
Bitcoin
Bitcoin CPI
Venture Portfolio
Funds
Market Insights
Indicators






About
Contact

September 9, 2026



The Bitcoin Pi Cycle Top indicator has an impressively high hit rate, having flagged the 2013, 2017, and 2021 cycle tops within days, which has made it a popular Bitcoin indicator among chartists.
It was published in April 2019 by Philip Swift, the creator of the Bitcoin analytics platform Look Into Bitcoin and the managing director of Bitcoin Magazine Pro. He built it from two moving averages and a ratio that happens to land near the mathematical constant Pi.
Read on to learn more about Bitcoin’s Pi Cycle Top indicator.
The Pi Cycle Top indicator plots two moving averages of Bitcoin’s price: the 111-day simple moving average (111 SMA) and the 350-day simple moving average multiplied by two (350 SMA × 2). A signal fires when the 111-day average crosses above the doubled 350-day average, and this moment has historically marked the top of a Bitcoin bull cycle.
In other words, a cycle peak is indicated for 111 SMA ≥ (350 SMA × 2).
The Pi in the name comes from a coincidence in the underlying math. Dividing 350 by 111 results in roughly 3.153, which is relatively close to the value of Pi, π = 3.14159.
These two specific windows, 111 and 350, were chosen because they produced the best statistical fit against Bitcoin’s prior cycle tops. The resemblance to Pi turned out to be a memorable side effect and ended up as part of the name.
Put plainly, the indicator tracks acceleration. The 111-day average has a shorter, more reactive read on price, while the 350-day average captures a comparatively broader trend.
When the short-term average doubles the pace of the long-term one, this would suggest that BTC may be trading at a level that the market can’t sustain. Historically, a correction has followed within days of this signal firing.
Reading the Pi Cycle Top chart is very straightforward. Both moving averages plot directly on top of Bitcoin’s price, and all you have to do is watch for the crossover, which is when the 111-day line moves up through the doubled 350-day line.

Some charting tools – like those offered by Look Into Bitcoin, Newhedge, or Bitcoin Magazine Pro – let you track this in real time without having to plot it yourself, but the whole process is simple enough that you can use whichever tool you prefer.
Historically, this crossover has occurred within days of completed Bitcoin cycle tops, making it a tight window for any indicator.
This is also how the indicator is limited by design. It has fired once per cycle up until now, at the very top, and there’s no attempt to call bottoms, mid-cycle corrections, or any other short-term signaling.
The indicator’s reputation rests on three completed Bitcoin cycles, each confirmed after the fact.
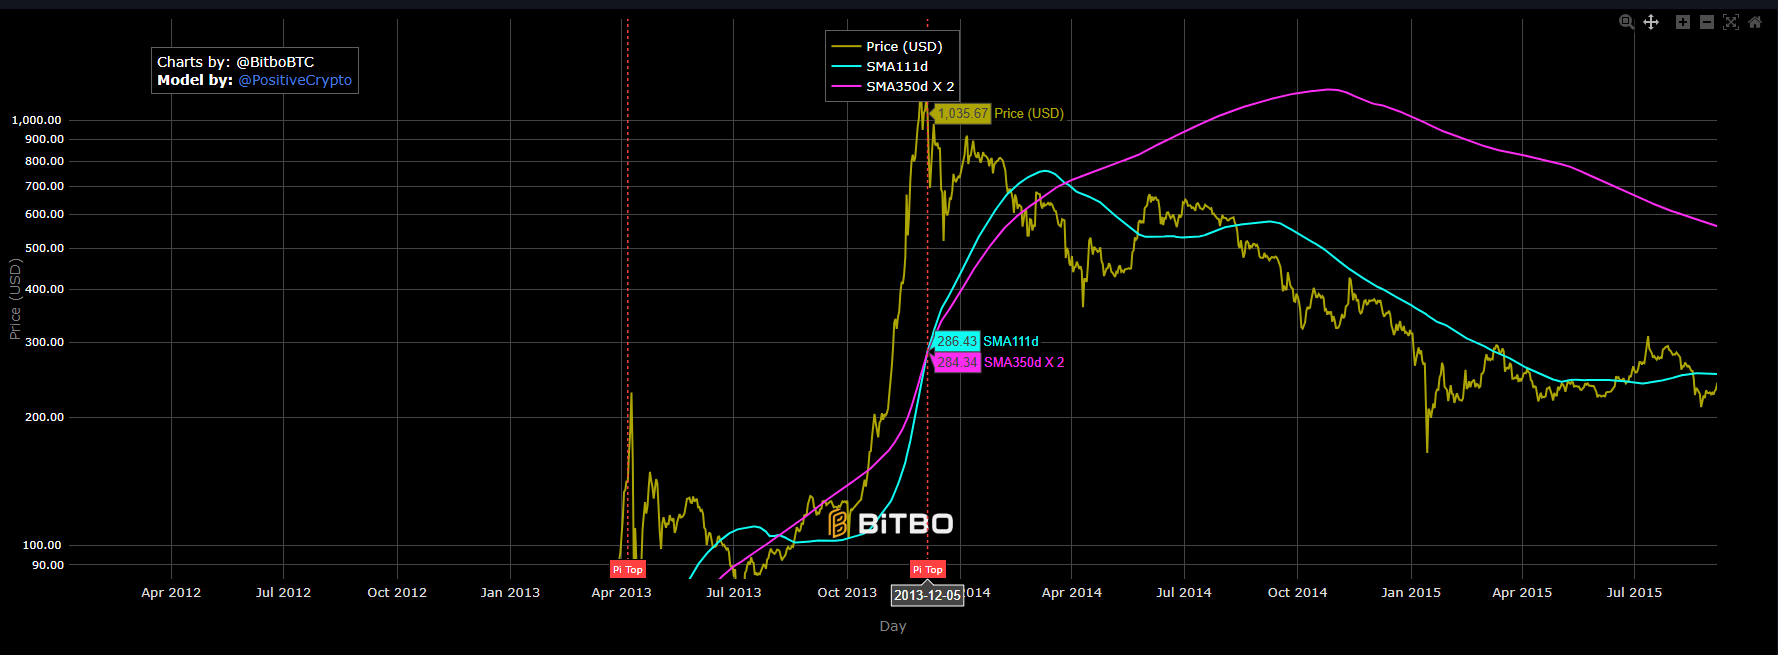
In 2013, the crossover fired on December 5, just before Bitcoin’s cycle peak at that time. After that, the price dropped roughly 86% over the following 623 days, according to BitMEX’s Pi Cycle indicator, making it one of the deepest and longest drawdowns in Bitcoin history.
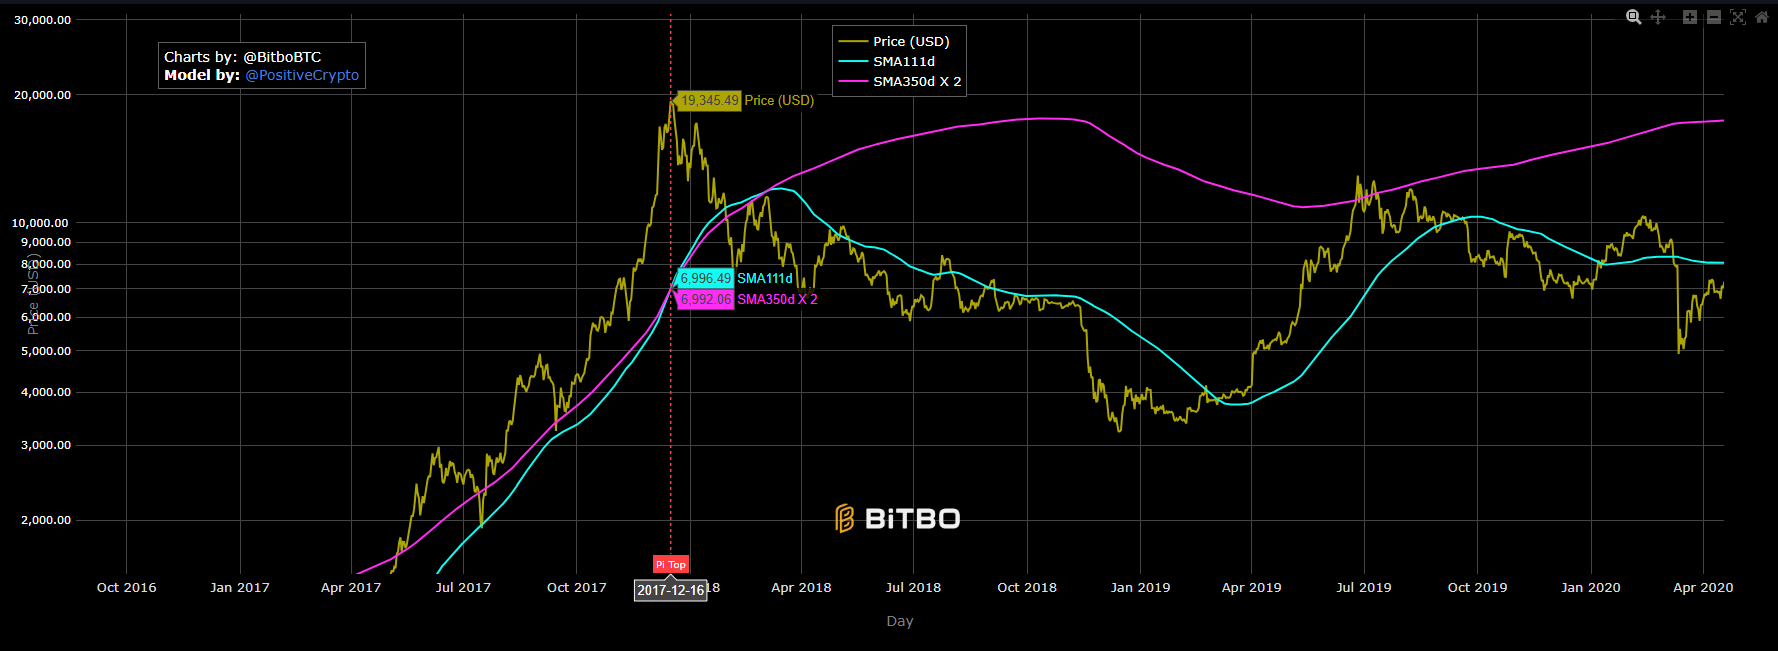
In 2017, the signal fired on December 16, again one day ahead of the top, which landed near $19,800. The subsequent decline ran roughly 84% over 364 days.
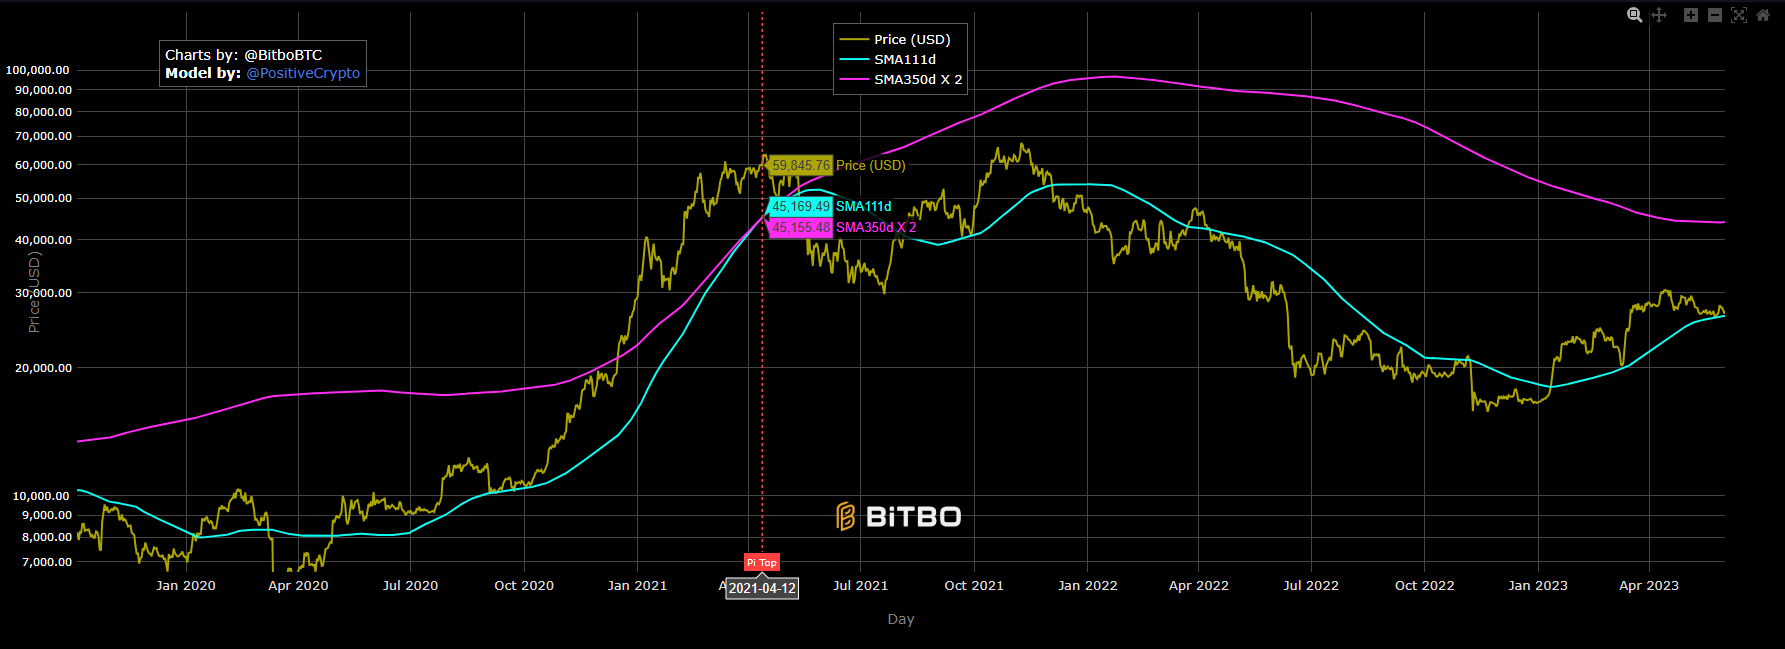
In 2021, the crossover came on April 12, two days before Bitcoin's peak of roughly $64,900 on April 14. That signal was followed by a correction of about 53% over 71 days.
However, it’s important to note that this was actually the April intra-cycle top and not the cycle’s true high. Bitcoin went go on to set a higher peak near $69,000 in November 2021, but the indicator never flagged it.
The most recent cycle topped in October 2025 with an all-time high of around $126,000, but the signal never even came close to firing. A large part of the debate comes down to the fact that as Bitcoin matures, its volatility has compressed relative to earlier cycles, so the 2x multiplier has come into question.
Some analysts argue that the gap between the 111-day and 350-day averages may never again widen enough to produce a clean crossover like 2013, 2017, or 2021.
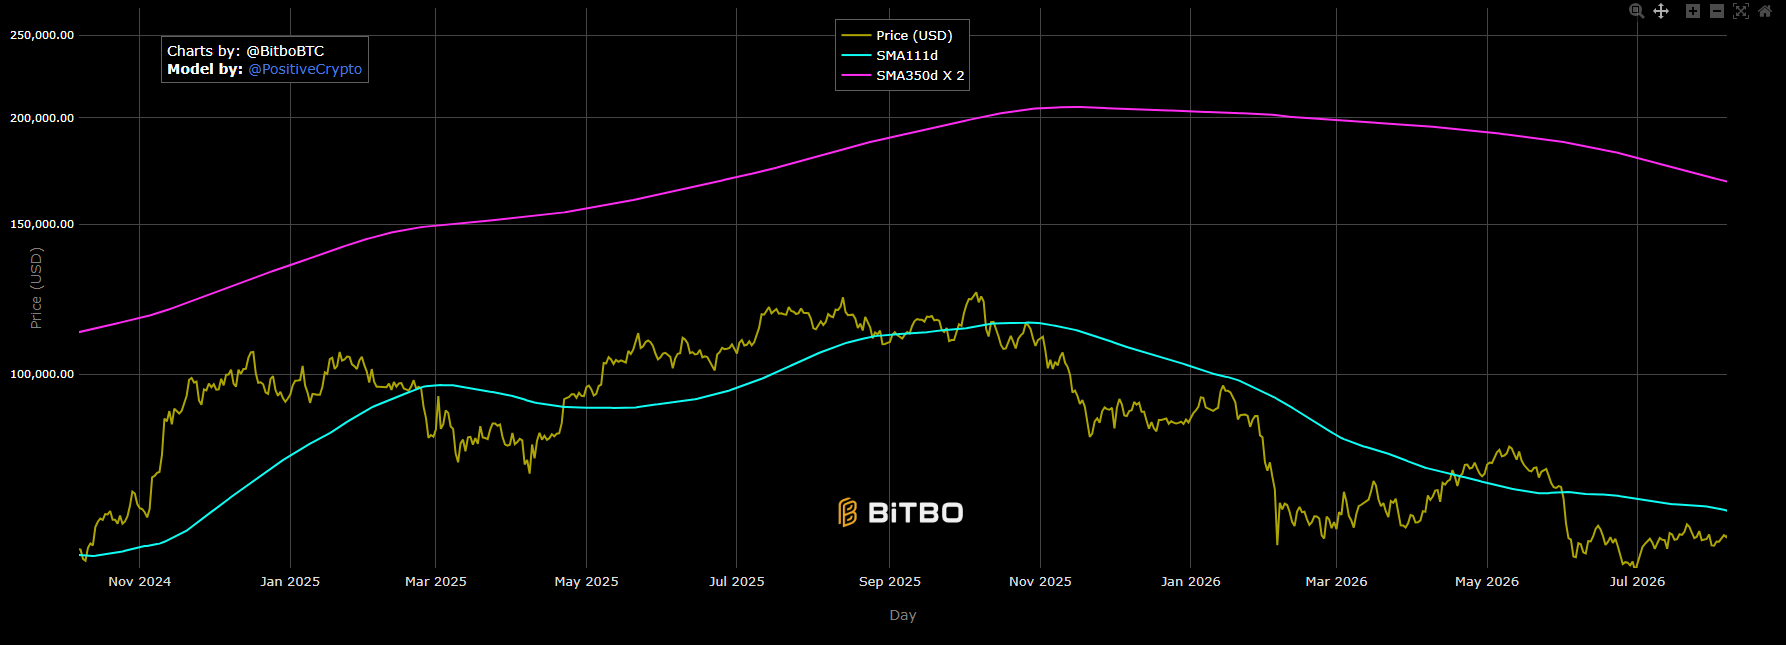
In fact, the 2021 signal, while accurate, projected a smaller percentage decline than in 2013 and 2017, which could be consistent with a maturing, less volatile asset that’s simply producing narrower crossovers over time.
The Bitcoin Pi Cycle Top indicator comes with some notable strengths that still make it attractive to analysts. These include:
On the other hand, the Pi Cycle Top also comes with its own share of limitations.
The Pi Cycle Top is most useful when used in combination with other signals, rather than in isolation.
Pairing it with NUPL or MVRV Z-Score can add on-chain confirmation. If the Pi Cycle fires while NUPL sits in Euphoria, both of the signals are materially stronger than either of them taken alone.
It could be paired with the Mayer Multiple for a related moving-average cross-check, as they’re both built from a similar logic of comparing price to a long-term average.
Additionally, the Pi Cycle Top pairs well with SOPR, which can help confirm whether holder behavior at a potential top looks like distribution, adding a transaction-level view to what the Pi Cycle Top infers purely from price.
Finally, conjunction with the Bitcoin Rainbow Chart gives it a longer-term valuation overlay that removes the need for any single moving-average crossover to bear the full weight of a cycle-top call.
The Pi Cycle Top has a strong track record, but only across a very small sample. So while it has fired consistently, the same volatility compression that makes Bitcoin a more mature asset may also make the classic crossover harder to produce going forward. Moreover, as with any other indicator, it should be treated as one input among several, and never as a signal to act on alone.
For other indicators that can help round out the picture, see our live Bitcoin indicators library.
The Pi Cycle Top indicator is a Bitcoin cycle indicator that signals when the 111-day simple moving average crosses above the 350-day simple moving average multiplied by 2. Historically, this crossover has coincided with Bitcoin cycle tops within days. It’s signaled across three cycles, so it’s still based on a relatively small sample size.
The Pi Cycle Top indicator was created by Philip Swift, creator of LookIntoBitcoin and Managing Director of Bitcoin Magazine Pro. He published it in April 2019 and built it by testing moving-average pairs against Bitcoin’s prior cycle tops until he found a combination that fit the historical pattern closely.
The Pi Cycle Top got its name from the fact that 350 divided by 111 produces roughly 3.153, which is close to the mathematical constant Pi (3.14159). The relationship is a coincidence of the math rather than the reason for the moving average choice. The name stuck because it was memorable and Pi itself doesn’t actually factor into the indicator.
The Pi Cycle Top indicator flagged the December 2013 top one day early, the December 2017 top one day early, and the April 2021 top two days early. Each of them was followed by declines of roughly 53% to 86%. This is a three-for-three record across three completed Bitcoin cycles, although it did miss Bitcoin’s higher November 2021 peak after firing earlier that April.
While the Pi Cycle Top’s historical hit rate is strong, it still rests on only three completed signals. This means that as volatility compresses across cycles, the 2x multiplier may become harder to reach in future cycles. Therefore, a clean crossover could become rarer, even at a genuine cycle top. It’s best treated as one input among several, with other on-chain metrics.
Disclaimer: None of the information in this article should be considered investment advice. Investors should consult their financial advisors to determine if any of the financial products and services mentioned in this article are a potential fit for their portfolios or not.


