
Bitcoin
Bitcoin CPI
Venture Portfolio
Funds
Market Insights
Indicators






About
Contact

September 7, 2026



Spent Output Profit Ratio (SOPR) is one of the most-cited on-chain indicators in Bitcoin analysis. It answers a deceptively simple question: are coins being spent at a profit or loss?
Bitcoin's on-chain data provides a picture of whether holders are selling at a profit or a loss when they move their coins. Renato Shirakashi proposed the SOPR metric in April 2019, and it has since been adopted by various on-chain analytics platforms.
This guide covers what SOPR actually measures, why the 1.0 line matters, what its key variants, aSOPR, STH-SOPR, and LTH-SOPR, tell us, and how investors put the metric to use.
SOPR compares the value of coins when they are spent to the price at which they were originally acquired, calculated across all spent Unspent Transaction Outputs (UTXOs) in a given period.
The indicator shows whether Bitcoin sellers are in profit or loss when they carry out their transaction on the blockchain. A UTXO is an individual unspent transaction output that represents spendable BTC.
It’s important to note that while SOPR assumes that coins being moved are being sold, this isn’t always the case, as at certain times owners can simply transfer coins between their own wallets. Despite this drawback, SOPR is a reasonable proxy of whether coins are being sold at a profit or loss.
The formula for calculating SOPR is pretty straightforward:
SOPR = Realized Value at Spend / Value at Creation of UTXO
By conducting on-chain analysis, BTC holders can observe whether their outgoing transactions from a wallet are in profit or loss. Aggregating this data within a particular timeframe produces the SOPR value that gets interpreted along the 1.0 line:
SOPR reveals holder behavior in real time, without relying on off-chain data. It gives a snapshot of actual market participants' actions, as it shows what investors are actually doing with their coins during a specific period. That means it captures the aggregate profit and loss realized on a particular day.
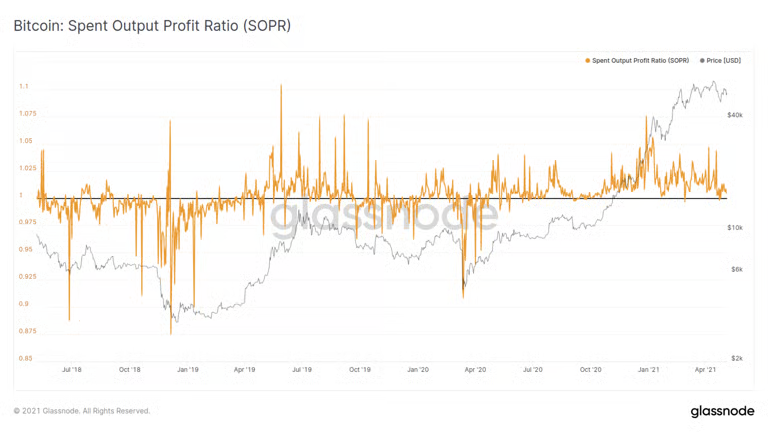
Reading the SOPR chart all comes down to tracking BTC’s price behavior around the key reference point: the 1.0 line. SOPR tends to oscillate around the number 1.
In bull markets, SOPR typically holds above 1.0, with pullbacks that reset to 1.0 acting as support. So, when the SOPR is above 1.0, Bitcoin holders may sell their coins at a profit. However, when the SOPR pulls back to 1.0, long-term holders might refuse to sell at a loss, which can cause the market to reset.
In bear markets, the trend flips. SOPR typically holds below 1.0, with rallies toward 1.0 acting as resistance. This happens as a result of HODLers often being reluctant to realize losses, so they wait for the price to recover toward the purchase price and sell at breakeven.
Some example patterns to look out for include:
Raw SOPR carries short-term noise from very young UTXOs. Its refined variants, aSOPR, STH-SOPR, and LTH-SOPR, filter out this market noise and separate the specific behaviors of different investor groups.
Adjusted SOPR (aSOPR) excludes all UTXOs with a lifespan of less than an hour, thereby eliminating obvious relay transactions. This, in turn, provides a more accurate signal of actual sale and purchase activities. It's the most widely quoted version of the metric, since it captures economically meaningful transactions.
Short-Term Holder SOPR (STH-SOPR) is another variant of SOPR that covers UTXOs with an age greater than an hour and less than 155 days. This variant captures the behavior and profitability of investors who have recently entered the market and are likely to react to market volatility.
Long-Term Holder SOPR (LTH-SOPR) covers UTXOs older than 155 days, serving as an indicator for assessing the behavior and profitability of conviction-holders who have a better understanding of the assets and more experience in market volatility. Long-term holders capitulating and selling at a loss have historically marked major cycle bottoms.
You might be wondering why 155 days, though?
Statistically, UTXOs older than 155 days are less likely to be spent and are generally considered part of illiquid supply, while UTXOs less than 155 days are more likely to be spent and are thus considered part of the liquid circulating supply.
Entity-adjusted SOPR goes a step further and removes internal wallet transfers to isolate genuine economic activity.
All SOPR variants can be used in different ways. Investors can use aSOPR for general cycle context, STH-SOPR for tactical, trader sentiment, and LTH-SOPR for cycle-conviction analysis.
Historically, SOPR has signaled major market cycles.
During the 2018 bear bottom, aSOPR spent extended periods below 1.0, following the aftermath of the 2017 ICO bust, while LTH-SOPR sank into deep loss territory, consistent with capitulation bottoms, as long-term holders finally gave up and sold at a loss.
The 2020 COVID crash saw the SOPR briefly plunge below 1.0 in March 2020, due to the liquidity crisis. However, SOPR then reclaimed and held, a behavior that confirmed that the crash was a temporary event rather than the beginning of a new bear phase. During the 2021 cycle, SOPR spent most of the period above 1.0, with visible resets at each major pullback. This was indicative of a healthy uptrend pattern.
In the 2022 bear market, LTH-SOPR reached one of its deepest historical prints as long-term holders capitulated following the FTX collapse, with the bottom following within weeks. This would remain the same until the 2024-2025 bull run, where SOPR held above 1.0 throughout, culminating in BTC’s run to the October 2025 all-time high.
2026 has been a correction year. aSOPR has been hovering around the 1.0 line multiple times. However, there hasn’t been a decisive breakdown or a clean reclaim. Whether it consolidates back above or breaks lower is a key signal to watch.
Now, let’s take a look at some benefits of SOPR.
And as no Bitcoin metric is void of shortcomings, below are some drawbacks of SOPR.
Investors and traders looking at Bitcoin indicators typically don’t use them in isolation. They combine them with other indicators. SOPR can be paired with other indicators, such as MVRV Z-Score, Mayer Multiple, or Bitcoin Power Law.
Pairing SOPR with MVRV Z-Score provides an on-chain valuation picture, as MVRV Z-Score measures periods where Bitcoin is extremely over- or undervalued by introducing a standard deviation test that isolates extremes in the gap between the two. An extreme Z-Score reading becomes far more convincing when SOPR confirms holders are actually making profit or capitulating at a loss.
Mayer Multiple indicator offers cross-methodology confirmation from a purely price-based angle. When this is paired up with a Spent Output Profit Ratio reading at 1.0, or in deep capitulation, both offer a stronger signal than each independently.
The popular Bitcoin Power Law indicator adds long-term positioning context. Paired with SOPR, it can help frame whether macro price deviations are happening within a wider structural growth trend or against it.
SOPR complements the on-chain valuation family by answering the question of whether coins are being spent at a profit or loss. Where MVRV Z-Score, the Mayer Multiple, and the Puell Multiple indicate where Bitcoin sits in its cycle, SOPR shows real-time behavior of how holders are reacting to the asset’s price.
SOPR (Spent Output Profit Ratio) is an on-chain indicator that measures whether Bitcoin holders, in aggregate, are spending their coins at a profit or a loss. A value above 1.0 means coins are being spent at a profit, while below 1.0 means at a loss.
SOPR was proposed by on-chain analyst Renato Shirakashi in 2019. It has since become a standard cycle indicator on major on-chain data platforms including Glassnode, CryptoQuant, and Bitcoin Magazine Pro.
Raw SOPR includes every spent UTXO. Adjusted SOPR (aSOPR) excludes UTXOs younger than an hour to filter out noise and internal exchange transfers. aSOPR is generally considered the more reliable version.
When SOPR is above 1.0, it means that the coins moved on the network that day were sold for more than what they cost to acquire. This is usually typical of bull markets, with price drops toward 1.0 often finding support before the uptrend continues.
When SOPR is below 1.0, it means coins moved on-chain that day were sold for less than they were bought for, with holders realizing a loss rather than a profit. This is common in bear markets, and typically reflects capitulation, fear, or panic selling.
STH-SOPR covers coins with an age greater than an hour and less than 155 days, reflecting newer market participants. LTH-SOPR covers coins older than 155 days, reflecting long-term holders. The 155-day threshold is used because coins older than that are statistically less likely to be spent.
SOPR is calculated by dividing the value of a spent UTXO at the time it was spent by its value at the time it was created, aggregated across all spent UTXOs in a given period. Simply put, the price sold divided by the price paid. The formula is SOPR = Realized Value at Spend / Value at UTXO creation.
Disclaimer: None of the information in this article should be considered investment advice. Investors should consult their financial advisors to determine if any of the financial products and services mentioned in this article are a potential fit for their portfolios or not.


