
Bitcoin
Bitcoin CPI
Venture Portfolio
Funds
Market Insights
Indicators






About
Contact

September 7, 2026



Bitcoin’s current price tells you what the digital asset is worth today (in fiat terms), while the Bitcoin’s Net Unrealized Profit/Loss (NUPL) indicator tells you how the entire market “feels” about the asset.
The metric translates the aggregate profit and loss sitting across the whole Bitcoin supply into named emotional bands, which include Capitulation, Hope/Fear, Optimism/Anxiety, Belief/Denial, and Euphoria/Greed, turning raw on-chain data into a read on collective investor psychology.
NUPL was introduced in research published by Adamant Capital by Tuur Demeester, Tamás Blummer, and Michiel Lescrauwaet, and was later standardized by on-chain analytics platforms such as Glassnode.
This guide explores what NUPL actually measures, why its emotion bands have held up as a framework across different market cycles, how the metric relates to Market-Value-to-Realized-Value (MVRV), and how investors use it in practice.
NUPL is the ratio of unrealized profit (or loss) sitting across the entire Bitcoin network to the current market cap. It provides insight into aggregate market sentiment and the profitability of Bitcoin holders, while also serving as an important indicator for market trends. It’s calculated by subtracting the Realized Cap from the Market Cap, then dividing by Market Cap to express it as a percentage.
The formula is:
NUPL = (Market Cap − Realized Cap) / Market Cap
Bitcoin’s market cap is the known figure, which is derived by multiplying its current price by its circulating supply. However, the more interesting input is the Realized Cap, which is the value placed on each coin based on the last on-chain price it traded at, rather than solely on its current spot price. That means Realized Cap regards every coin’s most recent transaction as its cost basis.
Subtracting Realized Cap from Market Cap isolates the aggregate dollar value of unrealized gains or losses in Bitcoin, but that raw figure scales with the size of the market itself, making it a poor basis for comparing sentiment across periods. Dividing that number by Market Cap normalizes it into a clean percentage, giving us the NUPL.
The NUPL, therefore, offers insight into market-wide sentiment.
If the NUPL is > 0 (positive), the total BTC market is in collective profit, and holders would make money if they sold right now. On the other hand, if the NUPL is < 0 (negative), the total BTC market is in collective loss, and holders would lose money if they sold.
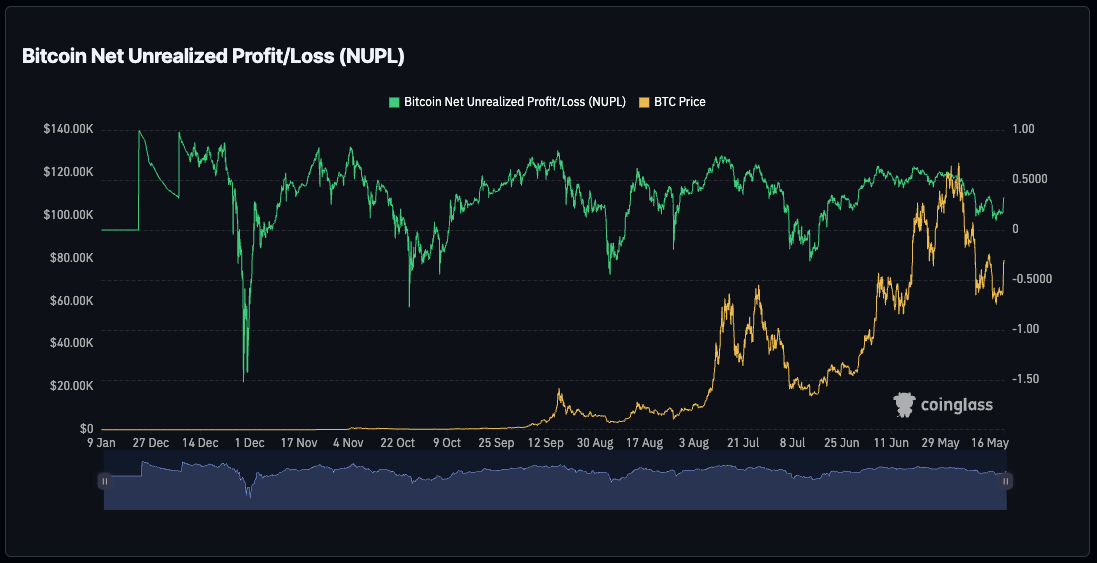
Chart by Coinglass
Higher positive readings generally correspond to increasingly optimistic market sentiment, with extreme values reflecting euphoria, while a negative NUPL ushers investors into a phase of capitulation and apathy. Therefore, the further the NUPL moves away from zero in either direction, the more intense the collective position, ranging from hope to extreme panic or greed.
NUPL indicates whether market sentiment leans towards fear or greed. These sentiments can be segmented into different emotion bands:
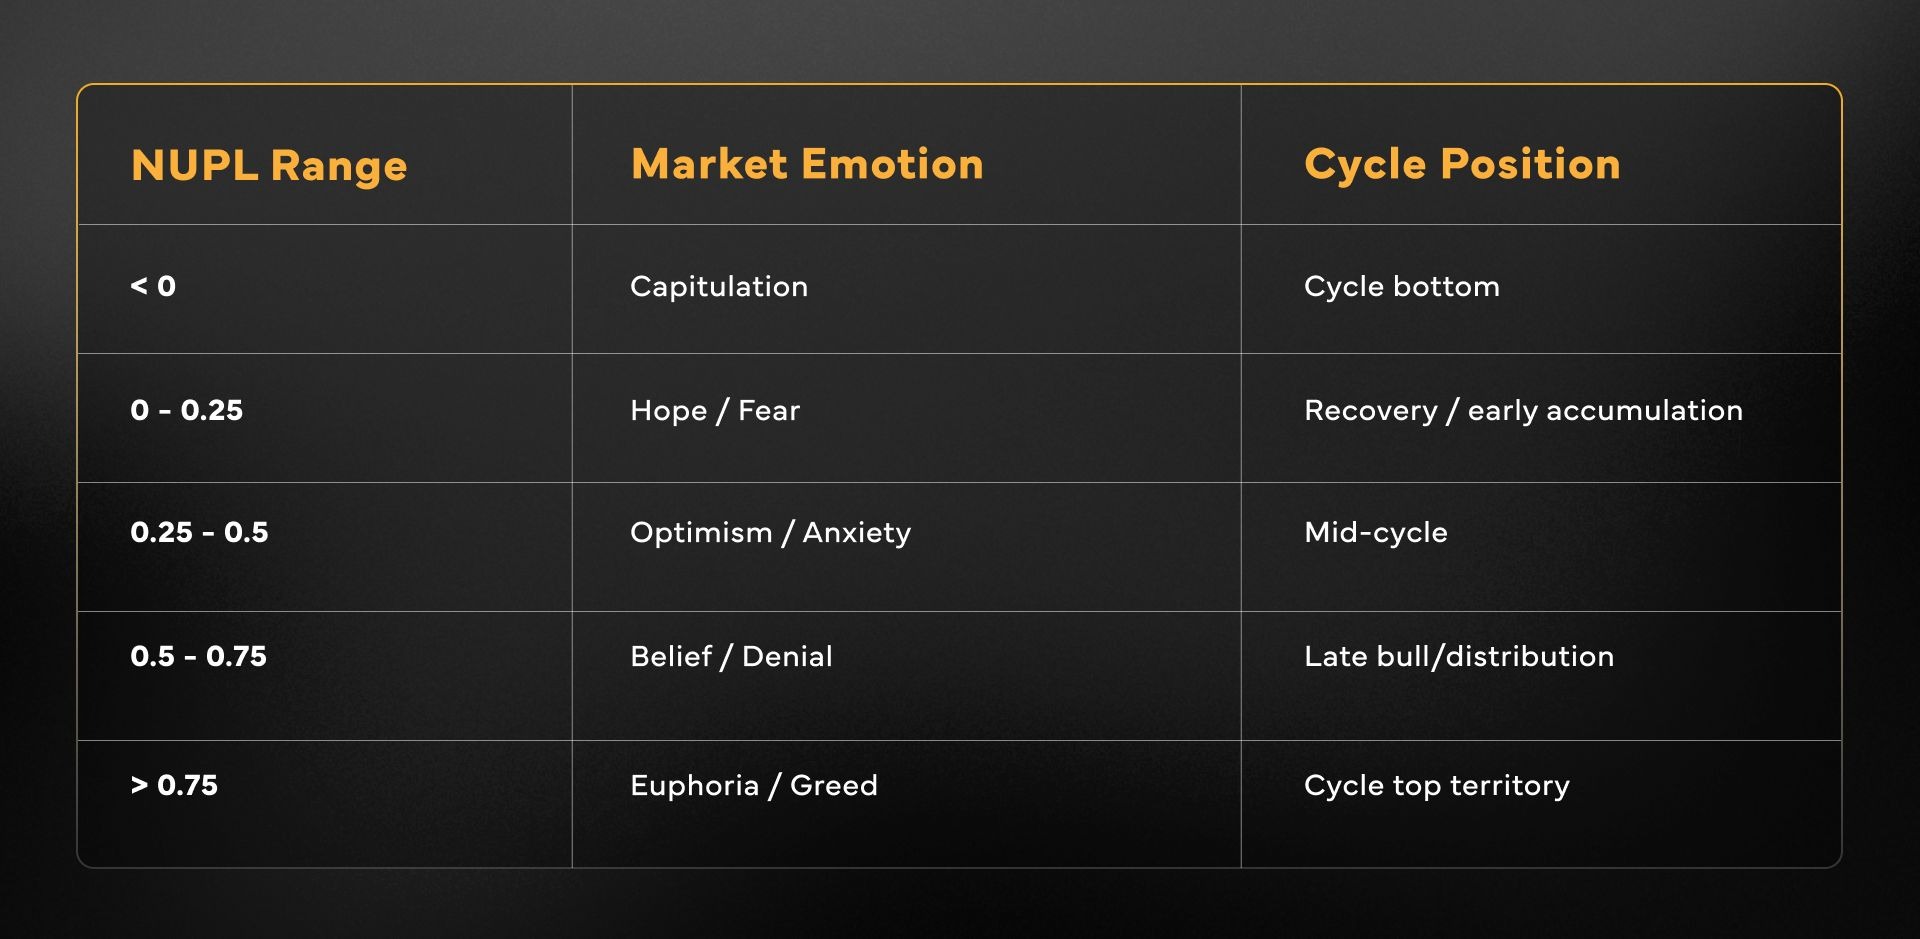
Each band is deliberately paired with two names, reflecting that the same NUPL level can carry a different meaning depending on the market's direction of travel.
Take, for instance, the 0 to 0.25 band. When NUPL is climbing up out of Capitulation, that reading signals Hope. The worst appears to be over, and holders begin re-entering positions cautiously. But if NUPL is falling toward that same range from a much higher level, the identical reading signals Fear. Gains are eroding, and confidence is going down.
This is why the bands are named in pairs rather than as single labels. Each pair represents two opposite psychological states that can produce the same number, depending on whether the market is climbing or falling.
The two extremes, Capitulation and Euphoria/Greed, are where NUPL has historically proven useful. The Capitulation band, below zero, has coincided with cycle bottoms, leaving BTC holders sitting on unrealized loss and prone to selling from panic.
Once the selling pressure wears out, conditions for accumulation tend to improve, with investors looking to hold BTC long-term, steadily buying at low prices.
On the other hand, the Euphoria/Greed band, above 0.75, has typically coincided with cycle tops, with Bitcoin holders sitting on unrealized profits and the incentive to sell becoming increasingly overwhelming.
The bands between Hope/Fear, Optimism/Anxiety, and Belief/Denial describe the long stretches of a market cycle where sentiment is gradually building or eroding, instead of being at an extreme.
Net Unrealized Profit/Loss has historically signaled market sentiment extremes like euphoria at bull market peaks and capitulation at bear market bottoms. NUPL readings above 0.75 (Euphoria/Greed) have historically coincided with the macro market tops in 2011, 2013, 2017, and 2021. Each of these cycle tops meant that the majority of BTC investors were sitting on unrealized profit.
Negative NUPL (Capitulation) has historically shown similar consistency and coincided with major bottoms, including 2015, March 2020, and late 2022, which were all accompanied by panic-selling exhausting itself before recovery began to take place. Each of these cycle bottoms meant on-chain metrics recorded massive realized losses.
Despite the 2025 cycle top, the market entered the Belief/Denial band rather than the Euphoria/Greed zone, as BTC approached the October 2025 all-time high, with peak readings continuing the compression pattern of successive cycles. During this cycle, the NUPL didn’t rise above 0.75. It stayed below it.
Since the October 2025 peak, NUPL has drifted lower, indicative of a market correction. Whether NUPL stabilizes in Hope/Fear or continues sliding toward Capitulation is a key second-half signal that is closely being watched.
Like Mayer Multiple and MVRV Z-Score peaks, top-of-cycle NUPL readings have generally declined across cycles as the market matures.
NUPL doesn’t exist in isolation. It's one of three closely related and used metrics that use built Market Cap and Realized Cap in their core calculations. The difference between the three comes down to how each metric presents that relationship, which determines whether it's better suited to just getting a quick read on the market, reading market sentiment, or spotting statistical extremes.
The table below shows how they compare:
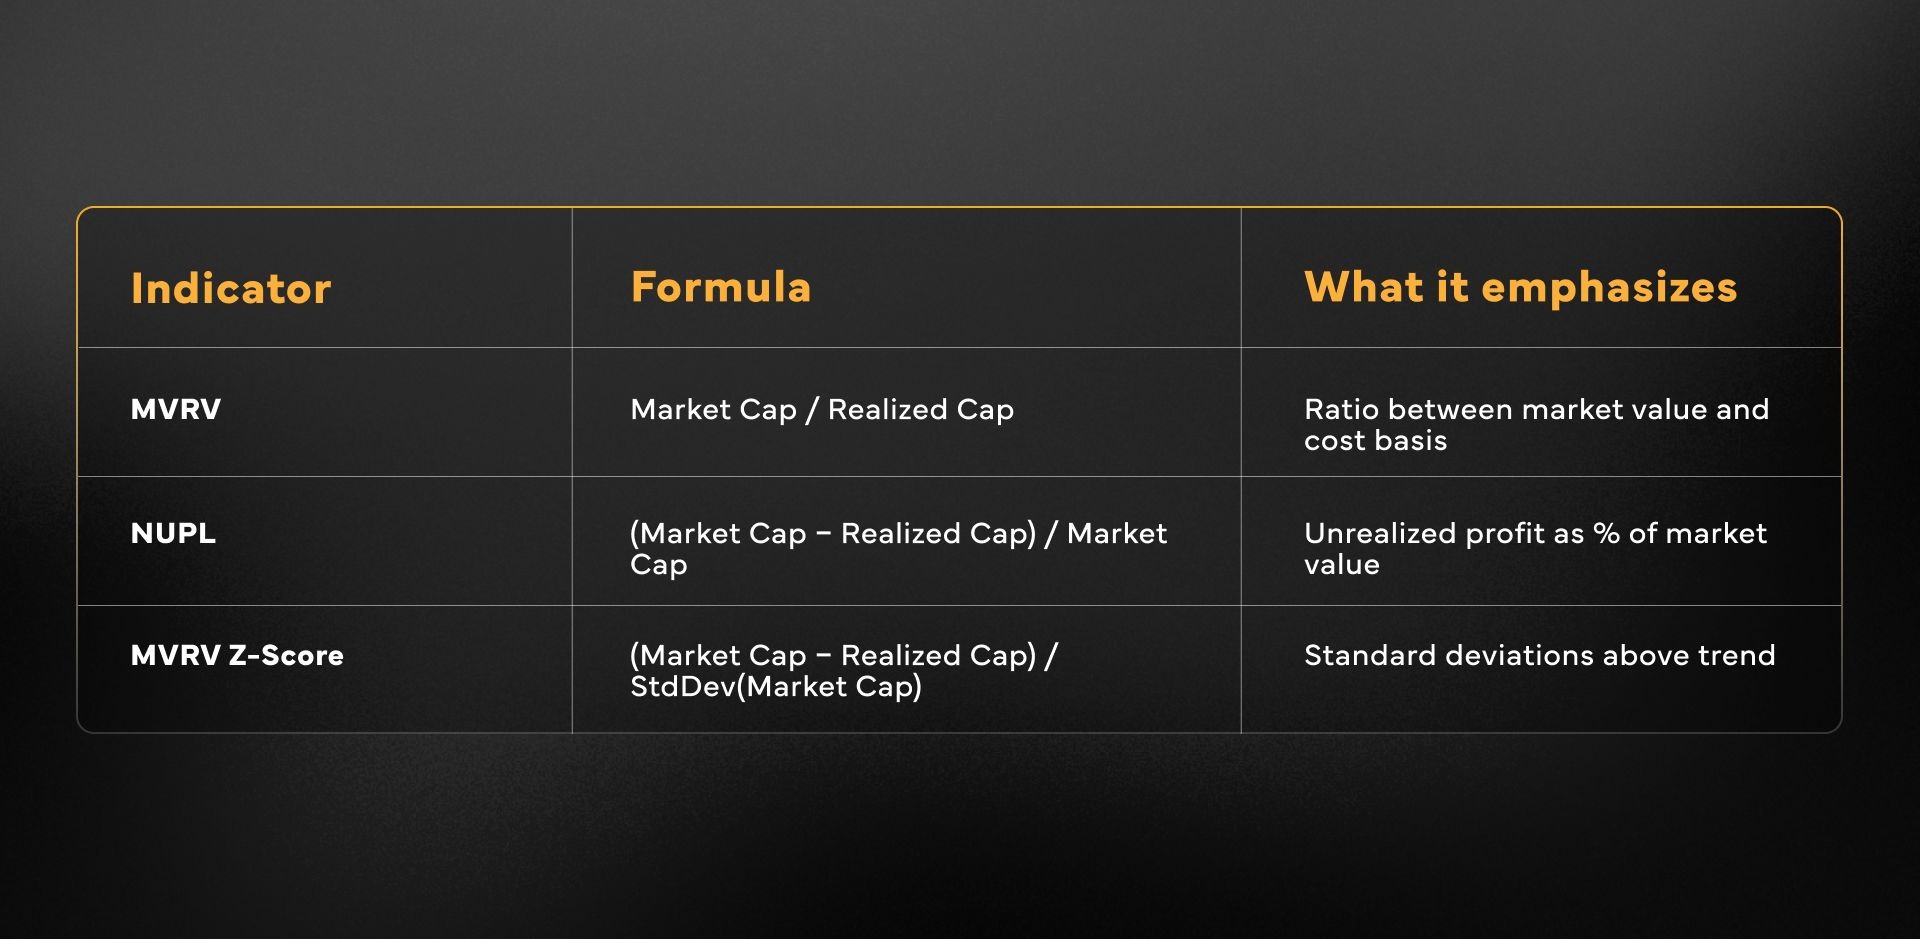
Out of the three metrics, the MVRV is the simplest. The indicator shows a straight ratio between market value and cost basis that helps to assess whether Bitcoin is trading significantly above or below its aggregate cost basis. It does this by taking the ratio between market value and realized value and plots that ratio over time.
NUPL is the most intuitive for behaviour framing. It calculates unrealized profit as a percentage of market value to map the market’s emotional state to objective data, from Capitulation through to Euphoria/Greed.
MVRV Z-score is the most rigorous for cross-cycle comparison. Rather than stopping at Market Value and Realized Value, it adds a Z-Score, a standard deviation test that isolates extremes in the gap between the two.
Now, let’s take a look at some benefits of the NUPL metric.
However, the NUPL metric isn’t without its criticisms and shortcomings.
Most investors who look at Bitcoin indicators treat NUPL as one of several indicators, using it alongside other metrics and not a standalone signal. Pairing it with other on-chain and price-based tools, such as the MVRV Z-Score, Mayer Multiple Indicator, Bitcoin Power Law, and SOPR, can offer an entirely different picture when used together.
While the MVRV Z-Score tells nearly the same story as NUPL, because they both rely on Market Cap and Realized Cap, the addition of the Z-Score to the MVRV Z-Score metric makes it arguably more useful for flagging extreme readings across different points in Bitcoin's history. Pairing the two lets you confirm whether a NUPL reading is statistically extreme or simply elevated compared to recent history.
On the other hand, SOPR introduces a dimension NUPL can't provide on its own, which is realization behaviour, i.e., the degree to which coins moved on-chain are being sold at a profit or a loss. Where NUPL shows where the emotional intensity is, SOPR shows whether holders are actually acting on it. The Mayer Multiple and Power Law models offer investors a cross-methodology tool built on price and long-term trend rather than on-chain cost basis. Using them alongside NUPL gives investors something that on-chain metrics alone can't.
NUPL’s true value lies in converting raw on-chain data into an intuitive measure of where the market sits emotionally at any given point. Like other metrics, it isn’t built to predict BTC’s price. Paired with indicators like MVRV Z-Score and SOPR, it becomes part of a broader lens for understanding sentiment, valuation, and behavior.
NUPL (Net Unrealized Profit/Loss) is an on-chain indicator that measures the aggregate unrealized profit or loss of all Bitcoin holders as a percentage of market cap, mapped to named market-emotion bands.
NUPL was developed from the work of Tuur Demeester, Tamás Blummer, and Michiel Lescrauwaet at Adamant Capital, and has since been standardized by on-chain data platforms including Glassnode.
NUPL has five major emotion bands which include: Capitulation (< 0), Hope/Fear (0–0.25), Optimism/Anxiety (0.25–0.5), Belief/Denial (0.5–0.75), and Euphoria/Greed (> 0.75). These emotion bands are used to track and visualize market sentiment.
NUPL is calculated by subtracting the Realized Cap from the Market Cap, then dividing by Market Cap to express it as a percentage. The formula is straightforward: NUPL = (Market Cap − Realized Cap) / Market Cap.
The difference between NUPL and MVRV lies in the presentation. Both metrics use the same inputs, but with different presentation: MVRV is a ratio; NUPL is a percentage of market cap with named emotion bands. MVRV Z-Score adds standard-deviation normalization for cross-cycle comparison.
Is NUPL still accurate as a cycle indicator?
NUPL’s core logic still holds as it continues to track cycles. However, peak readings have declined as Bitcoin's volatility compresses. It’s therefore best used as cycle context alongside other indicators, like SOPR, Mayer Multiple, or MVRV Z-Score.
Disclaimer: None of the information in this article should be considered investment advice. Investors should consult their financial advisors to determine if any of the financial products and services mentioned in this article are a potential fit for their portfolios or not.


