
Bitcoin
Bitcoin CPI
Venture Portfolio
Funds
Market Insights
Indicators






About
Contact

September 7, 2026



The Bitcoin MVRV Z-Score is one of the most cited on-chain cycle indicators in Bitcoin. A large part of its appeal and broad usability is that it uses only data available from the Bitcoin blockchain itself to act as a lens on the behavior of those who actually hold Bitcoin, aggregated across the entire supply.
This article will explain what the Bitcoin MVRV Z-Score indicator measures on its own, what the Z-Score adds to the picture compared with the raw ratio, and how investors use it today.

MVRV stands for Market Value to Realized Value. It’s the ratio of Bitcoin’s current market cap to its “realized cap”.
Formula:
MVRV = Market Cap / Realized Cap
Market cap by itself treats every coin as if it were bought at today’s price, but that’s not how the supply behaves. There’s a very different cost basis for a coin that last moved in 2011 than for one that moved last week. Realized cap accounts for that difference by valuing each coin at the price it last transacted.
In other words, that’s what makes the realized cap useful as a valuation anchor: it approximates the aggregate price paid by the market for the coins currently in circulation, rather than assuming the entire supply was bought at the current price.
Interpreting the MVRV ratio is simple:
In effect, this ratio gives us an on-chain measure of unrealized profit and loss across the entire Bitcoin supply. The number is anchored, verifiable, and independent of price alone.
Based on this interpretation criteria, a rising MVRV tells you that the market, in aggregate, is sitting on larger unrealized gains, which has historically correlated with increased incentive to sell.
Conversely, a falling MVRV works the opposite way. The market is somewhere around or below its cost basis, which has historically correlated with capitulation and, eventually, accumulation.
One limitation of the raw MVRV is that bull-market extremes have looked different across cycles. For example, early Bitcoin cycles reached an MVRV of 5 to 7 at the top, but later cycles have peaked closer to 3. This means that comparing raw MVRV readings across cycles isn’t very helpful on its own. The Z-Score fixes this by normalizing the raw dollar gap between market cap and realized cap by using the standard deviation of market cap.
Formula:
MVRV Z-Score = (Market Cap - Realized Cap) / Standard Deviation of Market Cap
In other words, the commonly used implementation calculates the difference between Market Cap and Realized Cap, normalized by the historical standard deviation of Market Cap.
With this adjustment, cycle extremes become comparable to each other, as it accounts for Bitcoin’s compressing volatility as the market has matured. The Z-Score asks how many standard deviations above or below the trend Bitcoin’s market cap is sitting right now, which is what analysts use to spot extreme readings.
The Z-Score isn’t measuring price but how far the current valuation has stretched from its on-chain cost basis, which is then scaled by the historical volatility of that stretch.
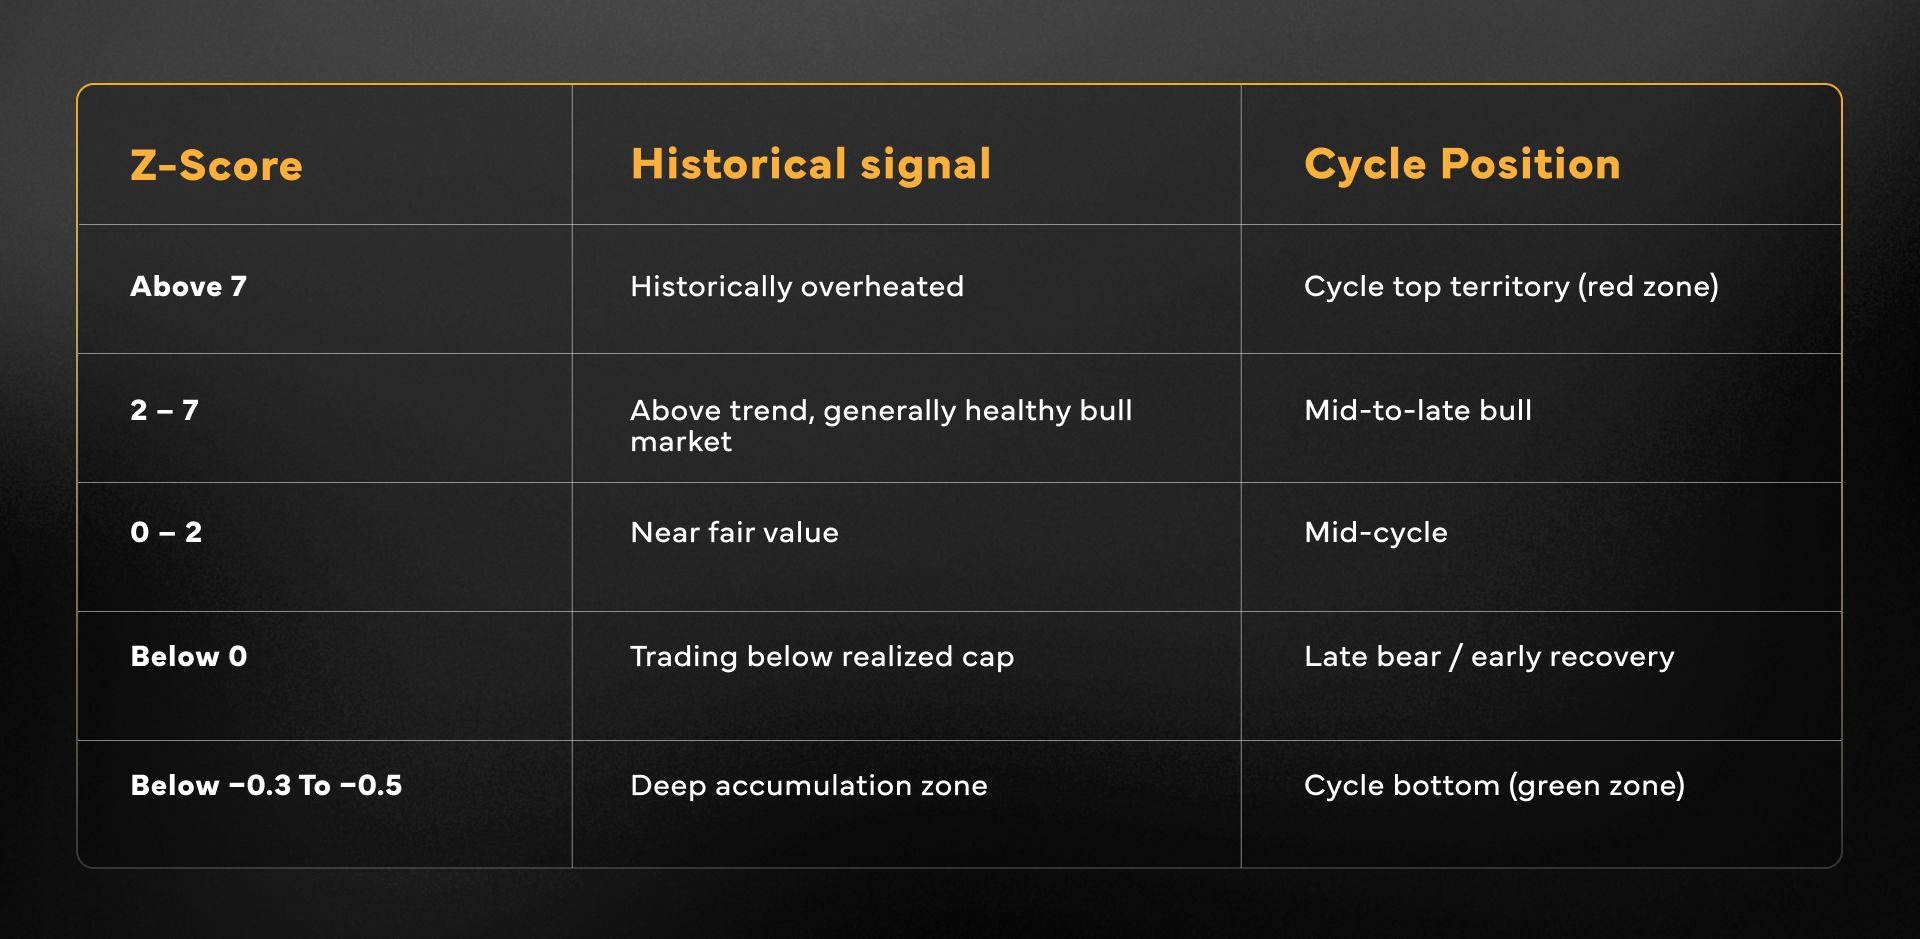
When it comes to reading MVRV Z-Score bands, historically speaking, there are numbers that have corresponded to signals.
The red band, above 7, has historically been one of the strongest overheating signals in Bitcoin’s history. On the opposite end, the green band, which can be found below -0.3, has historically aligned with major Bitcoin cycle lows.
These bands are derived from observing where the Z-Score has actually turned at prior cycle extremes, and represent an overview of past performance. However, that’s also their main weakness, as they describe only what has already happened. That means that reading the Z-Score for the first time should come with treating the bands as the historical reference range that they are, rather than a rule that the market should follow.
Like the Mayer Multiple, the Puell Multiple, and other cycle indicators, peak MVRV Z-Score readings have declined over successive cycles as the market has matured and its volatility has compressed.
As with any maturing asset, it’s a feature, not a bug, because as more capital enters Bitcoin and the market deepens, the amplitude of its swings (measured in standard deviations) naturally narrows.
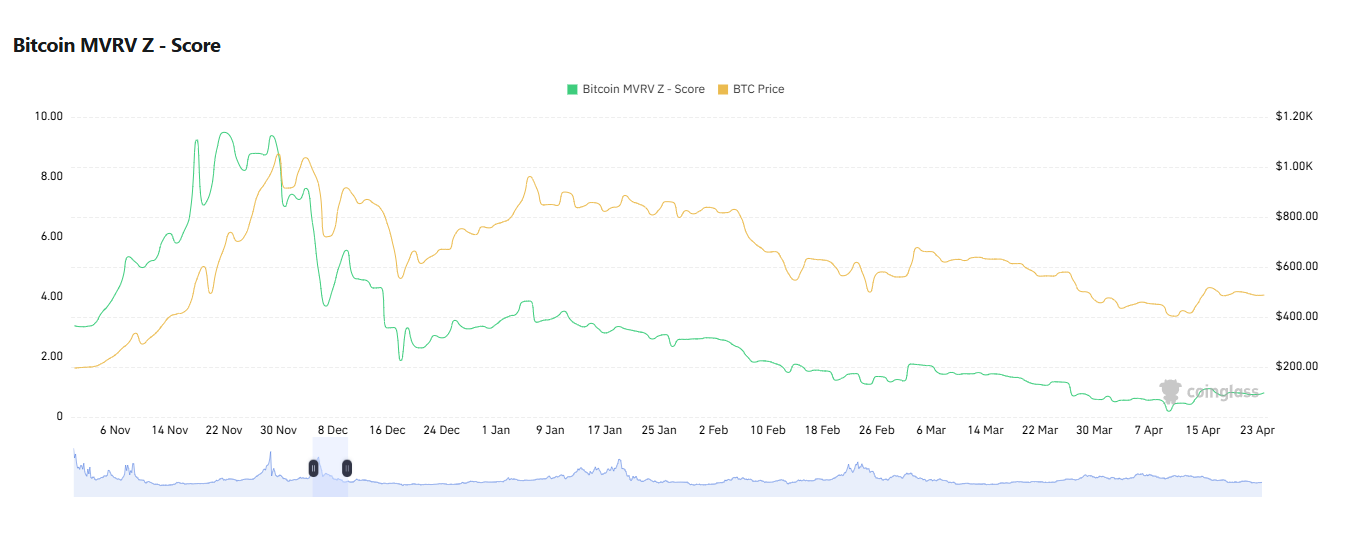
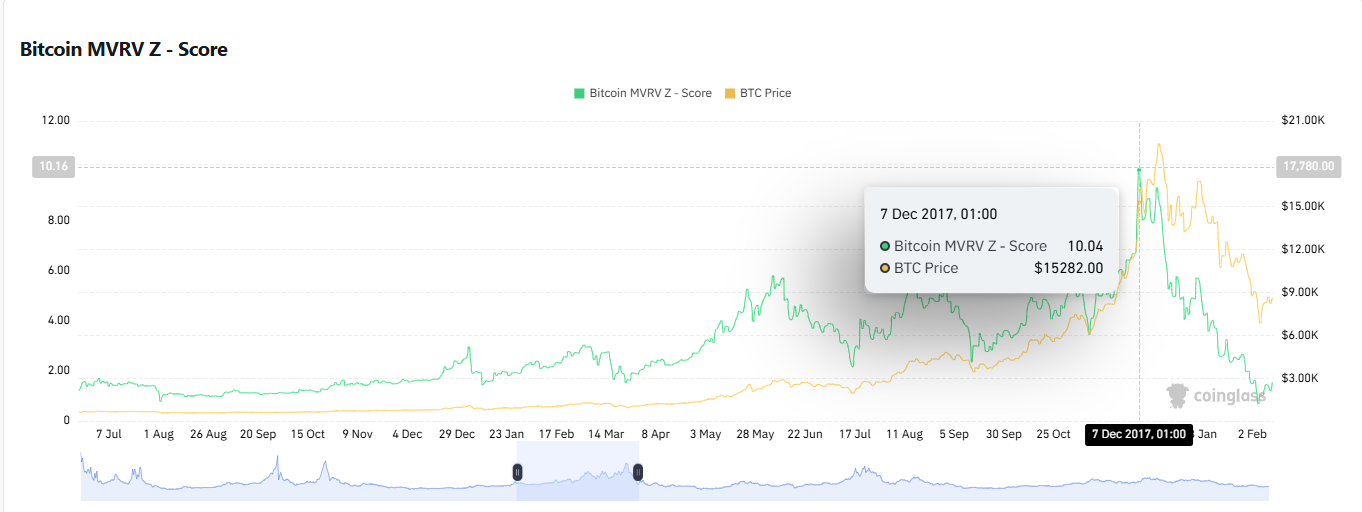
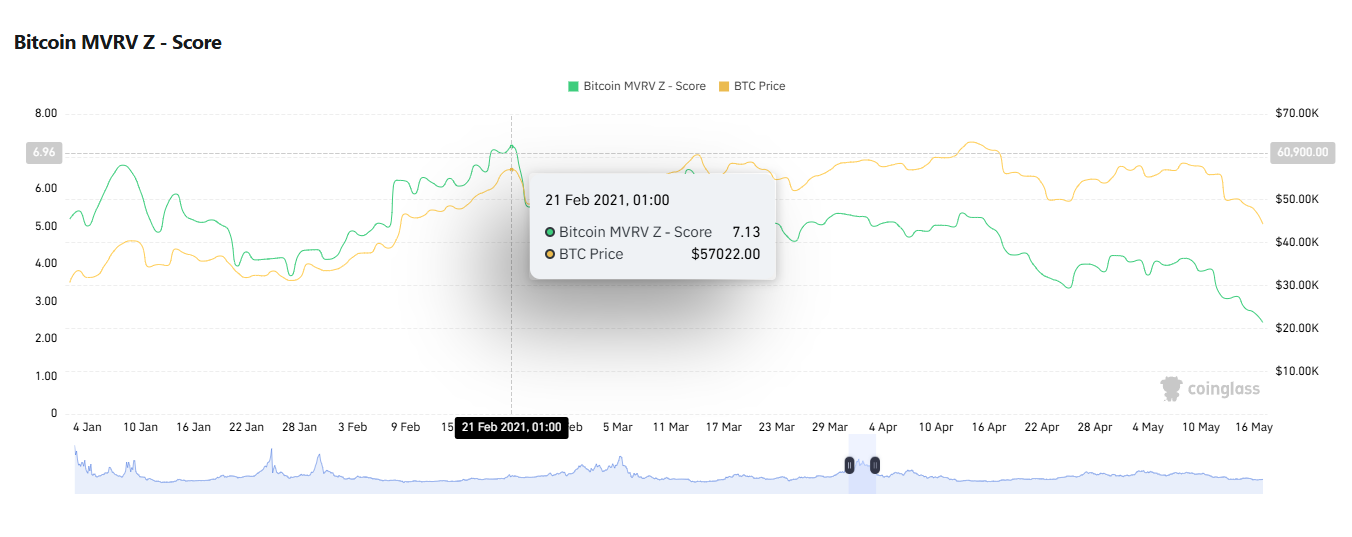
Looking through historical readings of the MVRV Z-Score, both peaks and troughs have seen consistent declines for this indicator, as well as numerous others, in line with the maturing market.
For a better overview, these are the Z-Scores for the peaks:
The bottoms follow a similar trend:
Between the 2013 peak of 10 and the 2021 peak of 7, nearly eight years and three full cycles have passed, which underscores the trend: each successive top has a lower Z-Score than the one before it, despite Bitcoin’s dollar price moving orders of magnitude higher.
A similar pattern holds on the downside.
The bottoms of 2015, 2018, and 2022 have all clustered in a similar -0.4 to -0.5 range, despite the actual bottom in dollar terms being wildly different.
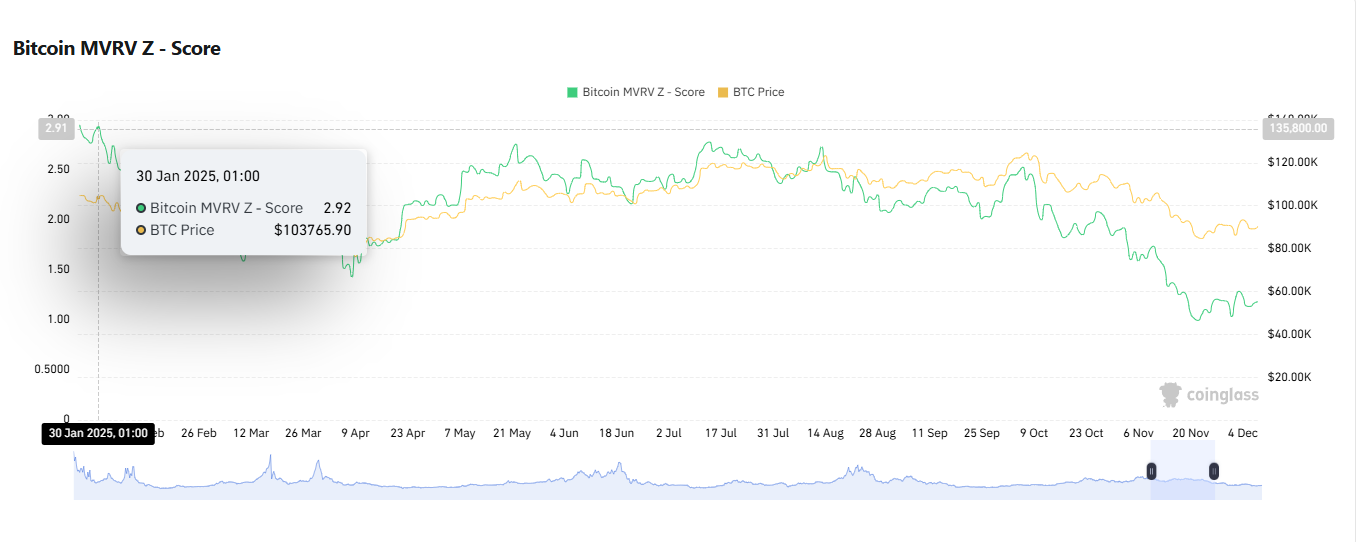
As of mid-2026, with Bitcoin having corrected from its October 2025 all-time high, the MVRV Z-Score has drifted meaningfully lower. The pattern is so far consistent with the broader compression trend seen across prior cycles, but a full cycle-position read will only be possible once the current cycle is complete.
There are several strengths that make the MVRV Z-Score such an important and widely used indicator:
The MVRV Z-Score doesn’t come without its limitations. Some of them include:
Another similarity of the MVRV Z-Score to other indicators is that it tends to work best when paired with certain indicators, rather than on its own. Some pairings that are worth considering are:
While one extreme reading from an indicator can be either a hint or a false positive, two or more simultaneous extreme readings, especially when they come from indicators built from different underlying data, can increase confidence in the historical interpretation. Once again, however, past performance is never a guaranteed predictor of future results.
On-chain cycle indicators like the MVRV Z-Score are more useful as context than as standalone signals. They help frame where Bitcoin sits relative to its own history, not when to buy or sell.
Other indicators that work well with the MVRV Z-Score are the Bitcoin Power Law and the Mayer Multiple, but all of them work best as analytical tools. Additionally, the BTCCPI is another way to think about Bitcoin’s monetary properties that can be useful as a reframing tool.
The MVRV Z-Score is an on-chain Bitcoin cycle indicator that measures the gap between Bitcoin's market cap and its realized cap, normalized by the standard deviation of market cap. It is used to identify when Bitcoin is trading at extreme overvaluation or extreme undervaluation relative to its own on-chain cost basis.
Historically, MVRV Z-Score readings above 7 have marked cycle-top territory. However, peak readings have declined over successive cycles as Bitcoin's market has matured, so future tops could form at lower Z-Score levels.
Historically, MVRV Z-Score readings below approximately −0.3 to −0.5 have marked deep accumulation zones. Bitcoin has caught every major cycle bottom while trading in this range.
The MVRV Z-Score continues to track Bitcoin's cycles, but its calibration drifts over time. As Bitcoin's volatility has compressed, peak Z-Score readings have gotten lower with each cycle. It works best as a cycle-context tool, not as a standalone timing signal.
The formula is: MVRV Z-Score = (Market Cap − Realized Cap) / Standard Deviation of Market Cap. Market Cap is Bitcoin's current price multiplied by its circulating supply. Realized Cap is the sum of every coin's value at the price at which it last moved on-chain. Standard Deviation of Market Cap is calculated on a rolling basis.
The raw MVRV ratio compares Bitcoin's market cap to its realized cap directly. The MVRV Z-Score normalizes that gap using standard deviation, which makes readings comparable across cycles despite Bitcoin's declining volatility over time.


