
Bitcoin
Bitcoin CPI
Venture-Portfolio
Fonds
Markteinblicke
Indikatoren






Über uns
Kontakt

July 7, 2026



The Mayer multiple is one of the simplest indicators in Bitcoin. It uses a simple calculation of price divided by the 200-day moving average to determine the position of Bitcoin in its cycle.
Created in 2015 by Trace Mayer, it has tagged every top and bottom for Bitcoin since.
Its simplicity is a key feature in its usefulness. Complex indicators can overfit history, thanks to the variety of parameters that can be bent until they match any point in the past. With one input, the Mayer multiple lets you check its position yourself if you want to. It can also work well in combination with other indicators.
The Mayer Multiple is an indicator defined as the ratio of Bitcoin’s current price to its 200-day moving average. It was created by early Bitcoin investor Trace Mayer in 2015.
He borrowed the idea from traditional finance, where the 200-day moving average is one of the most-watched levels. Mayer’s contribution was applying the line to Bitcoin and turning the distance from it into a cycle gauge.
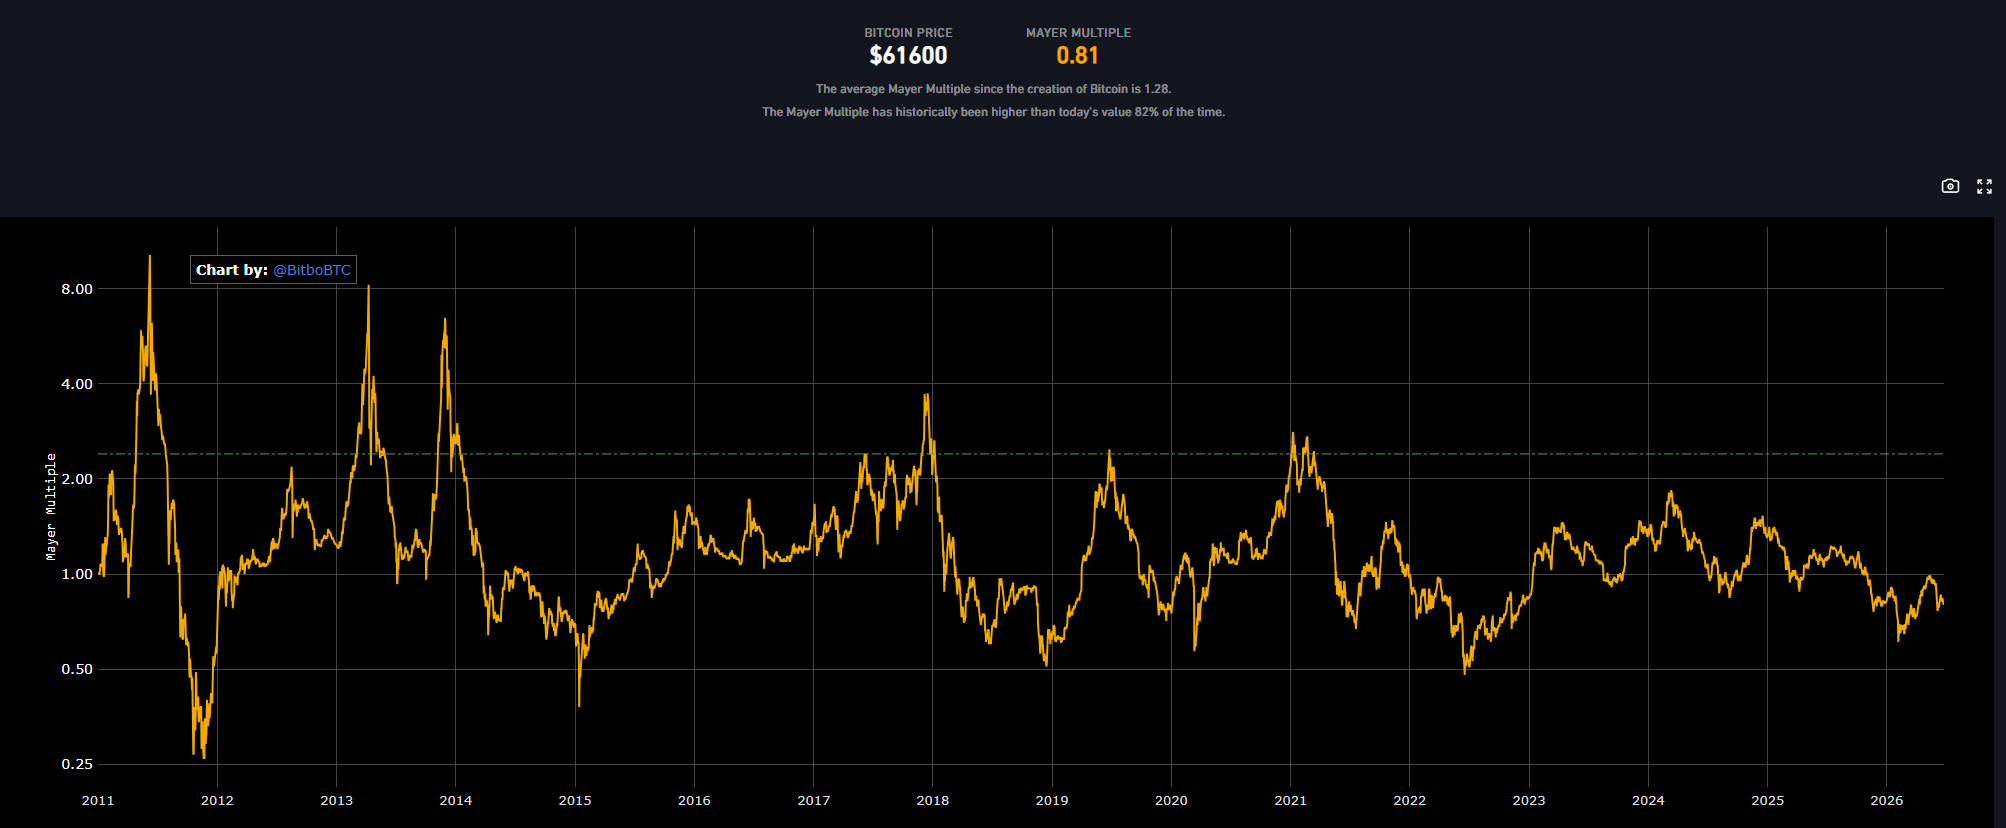
The formula is simple:
Mayer Multiple = Current BTC Price / 200-Day Moving Average
A reading of 1.0, for example, means that BTC is trading at exactly its 200-day average, while a reading of 2.0 means the price is double that average. If the result goes below 1.0, this means Bitcoin has slipped below its own long-term trend line.
The indicator’s purpose is as simple as the formula itself: it’s meant to answer the question of how far Bitcoin has run ahead of, or fallen behind, its own trend.
Calculating the Mayer Multiple is easy and consists of two steps total.
The first is calculating the 200-day simple moving average, which we’ll abbreviate to 200DMA here. This is done by taking the sum of all Bitcoin’s closing prices over the last 200 days, then dividing the result by 200. Although the calculation itself is simple in theory, it’s also time-consuming, so you can also use any charting platform to do the calculation for you.
The second step is dividing the current Bitcoin price by the 200DMA to get the Mayer Multiple.
As of late June 2026, Bitcoin is trading around $64,500, while its 200DMA sits near $78,000. This puts the multiple at roughly 0.83, meaning Bitcoin is trading about 17% below its long-term trend, in a band that has historically lined up with accumulation phases.
And while you can do the calculations by hand, the Mayer Multiple is commonly shown on a variety of different chart platforms.
The Mayer Multiple’s readings have historically tended to cluster in a way that gives it predictive value. Here’s how they tended to break down.
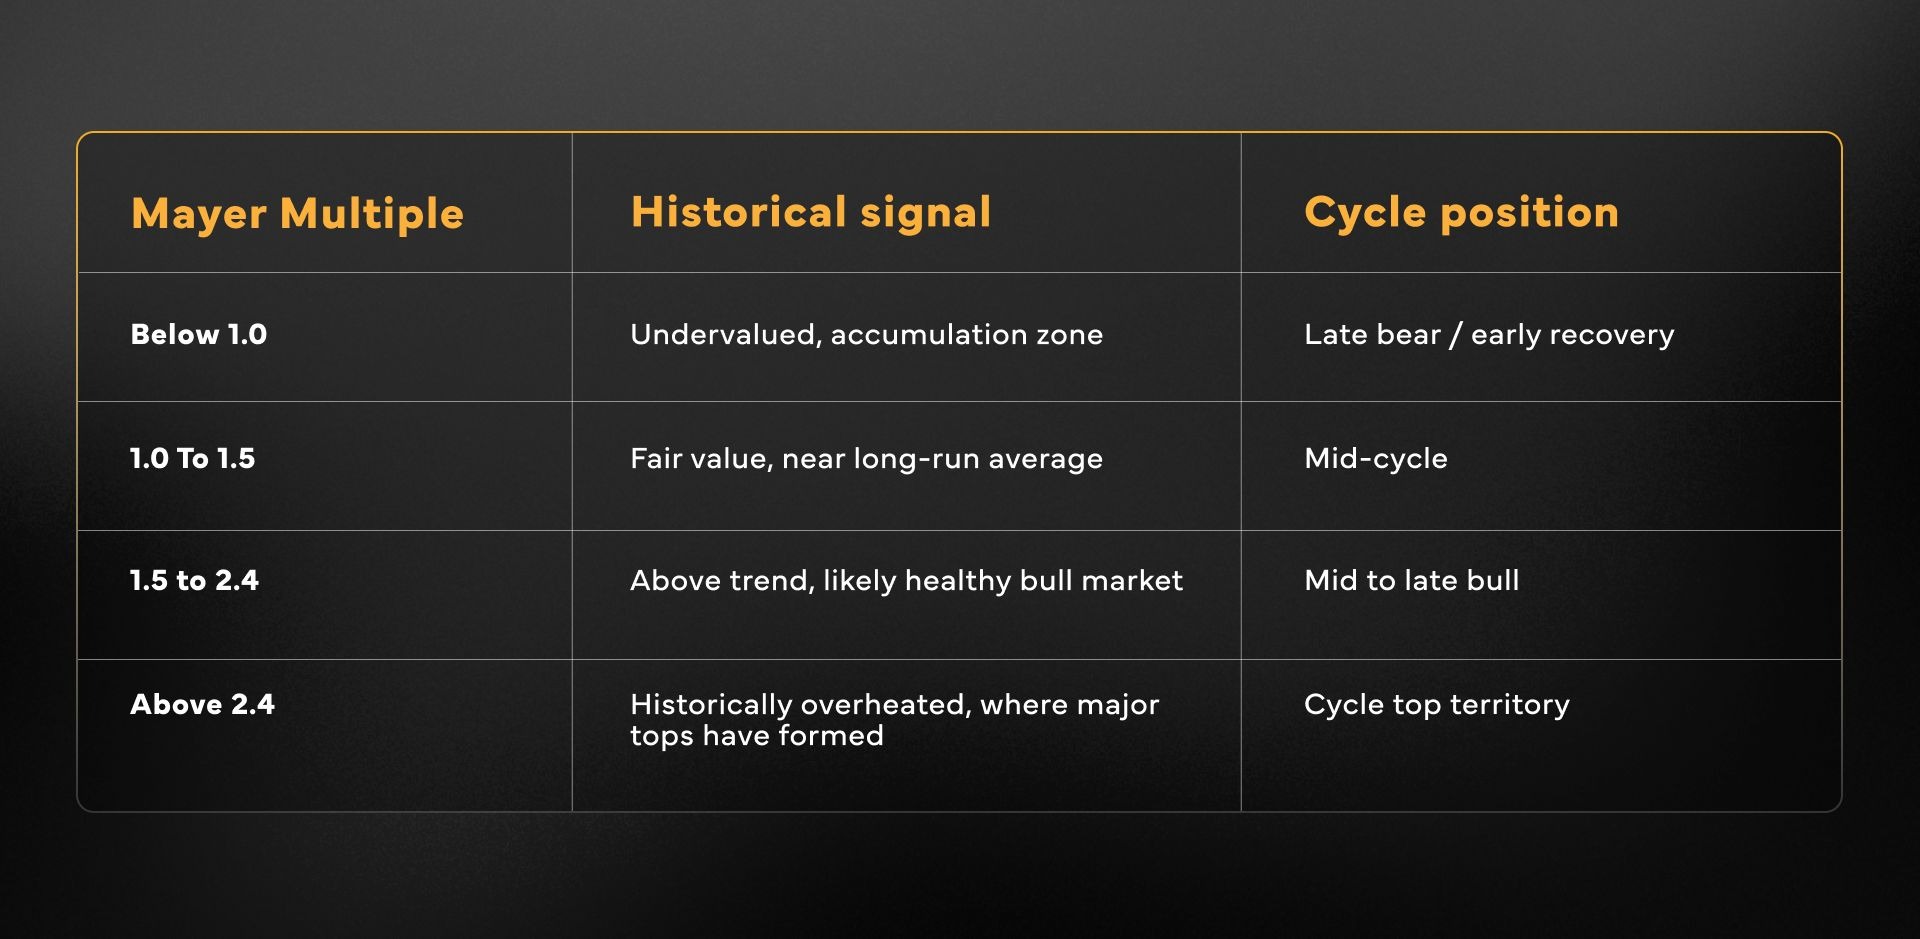
The two numbers usually making the biggest waves are 0.8 and 2.4. The deepest value readings drop below 0.8, which is the level many charting platforms mark as oversold. When the indicator is at or above 2.4, the market is tipping into a territory that doesn’t hold.
Mayer’s own backtests showed that accumulating BTC whenever the multiple sat below 2.4 produced the best long-run returns in the data he studied. The long-run average reading tends to sit around 1.4 to 1.5, which means that an indicator landing there should be considered closer to “normal” than to cheap.
However, none of this is law, nor can it predict future performance. Rather, it’s a statistical pattern across four completed cycles that’s never guaranteed to hold.
The Mayer Multiple has stayed consistent throughout the four cycles Bitcoin has had since its inception, including the one it’s currently in.
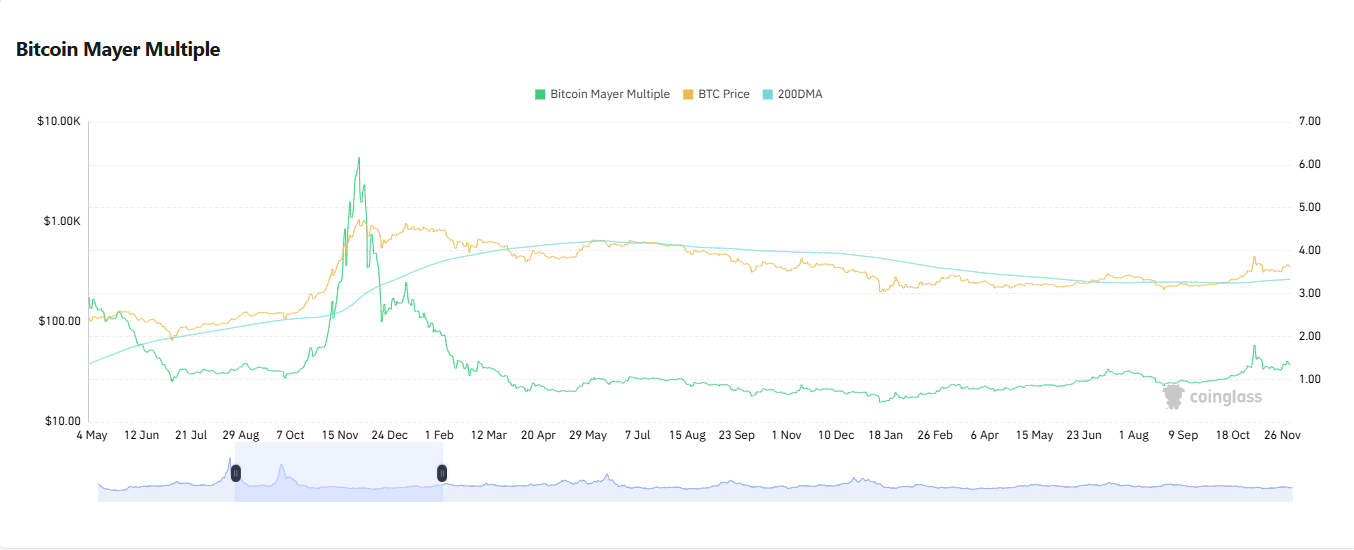
For example, during the 2013 top, the indicator peaked above 3.0 in late November 2013, just before BTC topped at ~$1,150. When it continued climbing to over 5.0 just after that, the price corrected lower, showing that the previous price marked a cycle top and was unsustainable in the long term.
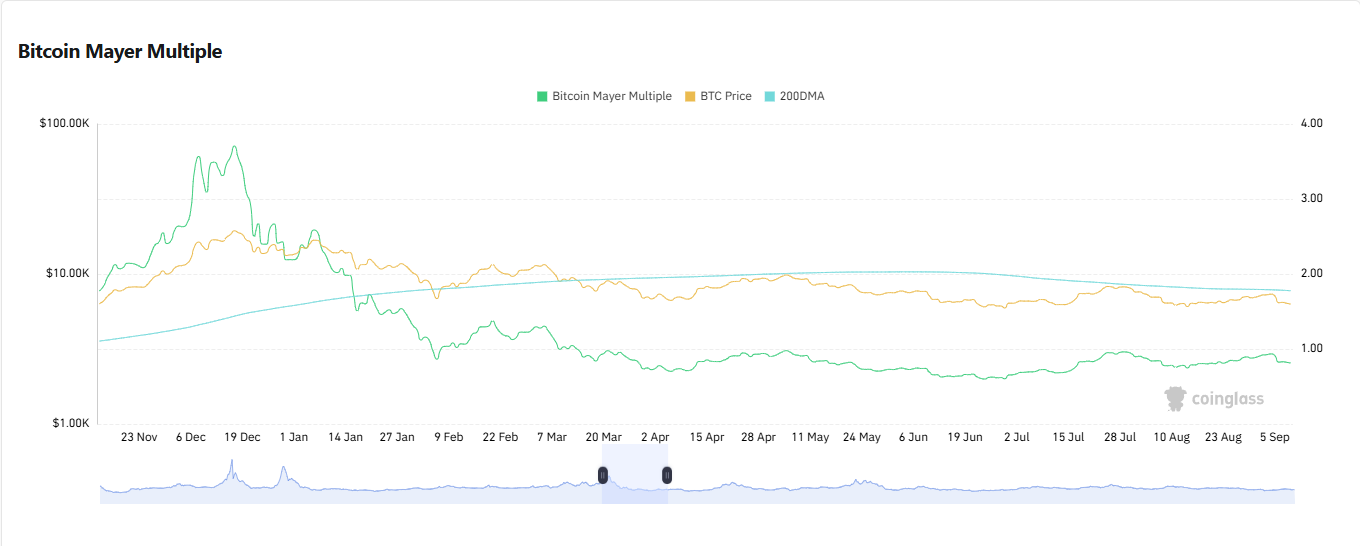
Then, during the 2017 top, something similar happened as the multiple peaked at around 3.4 in December, days before BTC would reach its new all-time high of $19,800 that would not be exceeded for years afterwards.
The readings were a little tamer when it came to the 2021 top. The Mayer Multiple peaked at around 2.0 in March and April 2021, which tends to denote a healthy bull market, but is not nearly as high as the previous readings. It would reach a mere 1.4 just before the ~$68.7k high of that cycle.
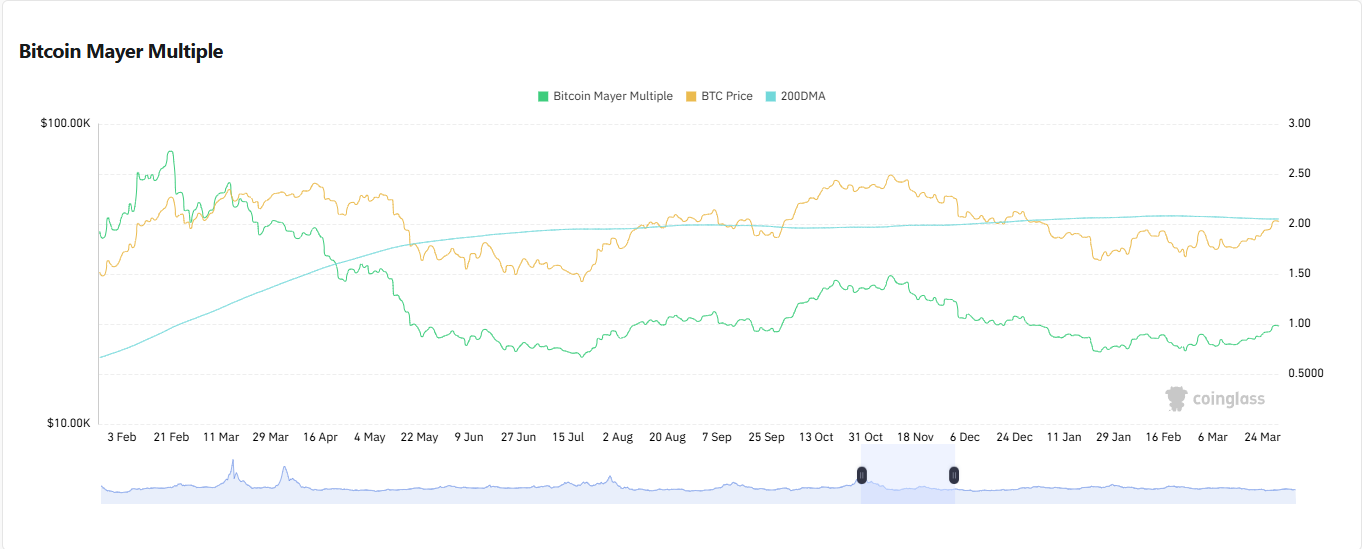
For these first three cycles, each cycle’s peak has come in lower than the last, showing a cooling trend that’s expected with Bitcoin’s market growing and volatility compressing. This also means that the thresholds for tops and bottoms may change with new data.
During the current cycle, which is in progress, the multiple is being watched closely. When BTC reached its newest all-time high of ~$126k in October 2025, the Mayer Multiple was barely ~1.18, which is well short of the previous 2.4 overheated zone on the way up. The price has since fallen around half as of late June 2026, and the multiple now sits below 1.0 for the first time since the previous bear market.
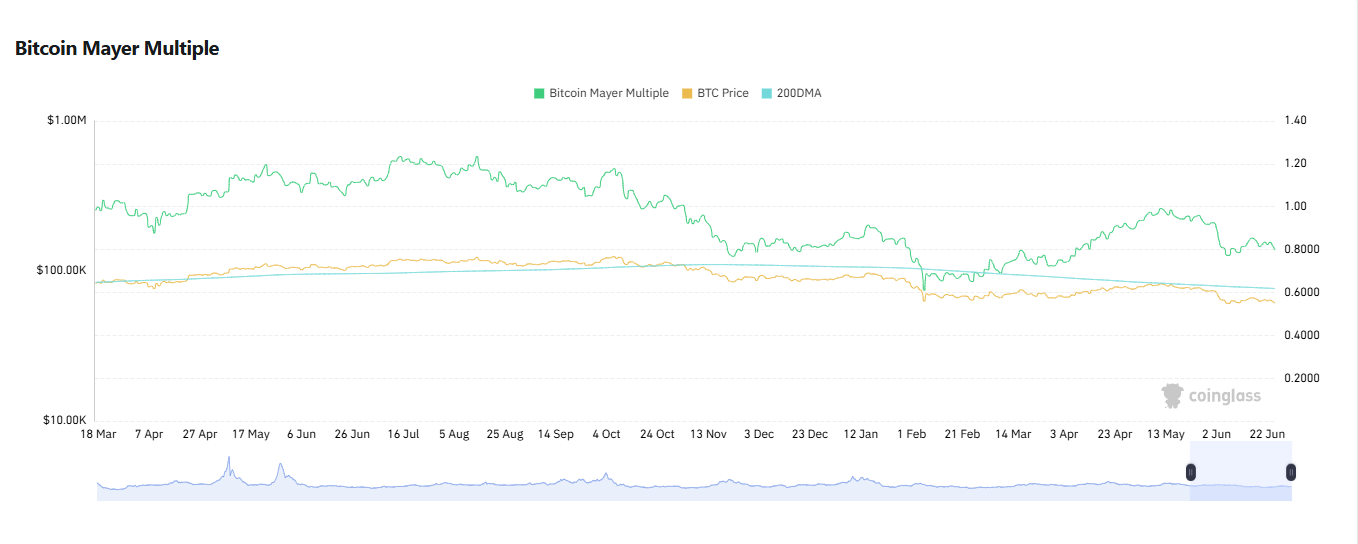
However, readers should keep in mind that a full retrospective analysis of the pattern for the 2025-26 cycle can only be done once the cycle is complete.
The Mayer Multiple has several strengths that place it among the more popular indicators. Some of them are:
Thanks to these different advantages, the Mayer Multiple often works as a sanity check against more elaborate models. When a complex indicator starts flashing, especially unexpectedly, comparing it to the Mayer Multiple can be a good way to check if the other model is in line with the basic picture or if its data is out of calibration.
The Mayer Multiple is not without its weaknesses, which are worth taking into account if you want to use the indicator.
Like any other indicator, the Mayer Multiple works best when other indicators are taken into account.
It can pair well with the Bitcoin Power Law for a long-term valuation frame. The Power Law models Bitcoin’s price against time, rather than a moving average, so the two answer different questions, making them especially useful when taken together.
When it comes to cycle confirmation, the Puell Multiple examines the same problem from the miner-revenue side, while the Bitcoin Rainbow Chart offers a quick visual band for long-term positioning.
Finally, if you’re looking to use the Mayer Multiple in conjunction with another indicator for tactical entry and exit timing, on-chain indicators like SOPR tend to work well. For the full set, our Indicators hub collects them all in one place, from which you can review and choose whichever works best for you.
In practice, this means that, while one flashing indicator offers a potential hint at most, two of them hitting extremes at the same time tend to offer a higher-conviction read. While past performance should never be taken as a future predictor, it can still be useful when determining the place in the cycle and what to potentially expect.
Like other trading indicators, the Mayer Multiple isn’t built to tell traders what Bitcoin is going to do next. Rather, it offers a fast and verifiable read on where the price is sitting relative to its own history, using a number you can easily check yourself.
Used with other indicators, it offers a companion view that can help determine the position of Bitcoin’s price. But its best features are still tied to past performance, which means it shouldn’t be taken as a predictive measure.
The Mayer Multiple is the ratio of Bitcoin's current price to its 200-day moving average, used as a gauge of where Bitcoin sits in its market cycle. A reading of 1.0 means the price is sitting exactly on its long-term trend, while higher readings show how far it has stretched above that trend, and lower readings show how far it has fallen below. Its main purpose is to flag when Bitcoin looks overheated or undervalued relative to its own history.
The indicator was created in 2015 by Trace Mayer, an early Bitcoin investor and podcaster. He borrowed the 200-day moving average from traditional finance, where it has long marked the line between a bull and a bear trend, and applied it to Bitcoin. His own backtests found that accumulating Bitcoin whenever the multiple sat below 2.4 produced the best long-run returns in the data he studied.
Readings above 2.4 have historically marked cycle-top territory, where major Bitcoin peaks have tended to form. However, the pattern has looked less reliable over time. Each cycle's peak multiple has come in lower than the last as Bitcoin's market has grown and its volatility has compressed, so a future top could form at a lower point.
Readings below 1.0 mean Bitcoin is trading under its 200-day average. The deepest value zones have dropped below 0.8 and those readings have been rare and short-lived. Bitcoin has reached every cycle bottom while trading below its 200-day average. As with the upside, this is a statistical pattern across a small number of cycles, not a guarantee.
The Mayer Multiple still tracks Bitcoin's cycles, but its calibration drifts as the market matures. The classic 2.4 top threshold has looked increasingly high as volatility has compressed, and the same is true at the bottom, where readings have not always reached the old extremes. It works best as a sanity check against more complex models rather than as a standalone signal.
The Mayer Multiple is calculated by dividing the current Bitcoin price by its 200-day simple moving average, which is the average of the last 200 daily closing prices. For example, with Bitcoin near $64,500 in late June 2026 and a 200-day average around $78,000, the multiple works out to roughly 0.83. You rarely need to do the math yourself, since most charting tools plot it automatically with the historical bands drawn in. Because the 200-day average moves daily, the multiple moves with it.


