
Bitcoin
Bitcoin CPI
Venture-Portfolio
Fonds
Markteinblicke
Indikatoren






Über uns
Kontakt

October 27, 2026



In 2025, investors in some listed companies were paying close to $2 of market value for every $1 of Bitcoin that those companies held. A year later, many of the same shares traded below the value of their coins. mNAV is the number that tracks this swing.
This guide covers what mNAV means, the formula, how to calculate it from public data, why premiums form and collapse, and what limitations the metric has.
mNAV, short for multiple of net asset value, is a metric that asks how much the market is paying for each unit of assets a company owns.
Strategy popularized the term and reports its own mNAV on its company dashboard. Because Bitcoin treasury companies hold mostly Bitcoin, their mNAV is usually read as the price of $1 of Bitcoin bought through the company’s shares.
The mNAV formula is calculated as follows:
mNAV = Market Capitalization ÷ Net Asset Value
There’s a difference between NAV (Net Asset Value) and mNAV (Multiple of Net Asset Value).
First, NAV is a currency amount. It is the value of everything a company owns minus its liabilities, stated in euros or dollars. mNAV, on the other hand, is a ratio with no unit attached. NAV describes the balance sheet, while mNAV describes how the market prices that balance sheet once it’s inside a listed share.
As an example, take a company that holds 1,000 BTC. At a Bitcoin price of $100,000, those coins are worth $100 million. The company carries $20 million of debt and owns nothing else, so its NAV is $80 million. It has 10 million shares trading at $12, which gives a market capitalization of $120 million.
$120 million ÷ $80 million = an mNAV of 1.5. Shareholders are paying $1.50 for every $1 of net assets. If the share price fell to $6, mNAV would drop to 0.75 with the balance sheet unchanged.
Below is a table showing how the mNAV number can be interpreted and what it has historically meant for share issuance.

To calculate a Bitcoin treasury’s mNAV, you need four inputs, all from different places:
As an example calculation, we’ll use a hypothetical company with the following round numbers:
We start with the gross Bitcoin holdings value, which is calculated by multiplying holdings by price: 5,000 × $100,000 = $500 million. Then, we calculate basic market capitalization from today’s share count: 40 million × $15 = $600 million. Divide by the gross Bitcoin holdings value for a basic mNAV of $600 million ÷ $500 million = 1.20.
The net-asset version instead uses net assets attributable to common shareholders, adding cash and deducting debt and preferred claims. Assuming the preferred stock represents a $50 million claim senior to common shareholders, and there are no other assets or liabilities, NAV is $500 million + $25 million − $150 million − $50 million = $325 million. On this basis, mNAV is $600 million ÷ $325 million = 1.85.
mNAV calculations vary in both their share-count assumptions and their treatment of assets and financing claims.
Basic calculations use existing common shares, while diluted calculations include additional shares under specified conversion or exercise assumptions.
Separately, a calculation may compare equity value with gross Bitcoin holdings value or with net assets attributable to common shareholders. An enterprise-value approach instead adjusts equity market capitalization for debt, preferred claims, and cash before comparing it with the relevant asset value.
Strategy’s own dashboard uses an enterprise-value version, which keeps the basic share count and adds the senior claims instead.
As of October 12, 2026, BitcoinTreasuries.net listed Capital B at 0.85x basic, 1.06x diluted, and 1.21x on an enterprise-value basis. This means that the same balance sheet produced a discount, a rough parity, and a premium, all at the same time. This is where many retail screeners go wrong by showing a single mNAV figure without saying which method produced it.
For raw data, start with primary filings (Strategy’s 8-K of August 18, 2025 on SEC EDGAR is a typical example), cross-check holdings on BitcoinTreasuries.net, and pull share prices from the listing venue, such as Xetra for German-listed companies.
For a pure Bitcoin accumulator, NAV is roughly BTC held × Bitcoin price − net debt. Keep in mind that that shortcut tends to break down as soon as a company owns other things, which we return to below.
mNAV premiums across the category built up through 2024 and into 2025 for a handful of reasons.
The first reason was access. Before U.S. spot Bitcoin ETFs launched in January 2024, and in markets where comparable products stayed restricted, a listed treasury company was one of the few ways to hold Bitcoin exposure in an ordinary brokerage or equity mandate. In other words, scarce access commands a price.
The second driver was the “BTC yield” flywheel. As an example, take a company with $100 million of NAV and an mNAV of 2.0. It sells $20 million of new stock, which adds 10% to its share count, and uses the proceeds to buy $20 million of Bitcoin. NAV rises to $120 million, but spread over only 10% more shares, so NAV per share climbs about 9%. At an mNAV of 1.0, the same trade adds nothing per share, while below 1.0 it takes value away.
Finally, the rest was largely driven by index inclusion and momentum. Strategy joined the Nasdaq-100 in December 2024, which brought passive demand, and rising prices drew in traders who were buying the trend.
Strategy is the clearest case study. By BitMEX's estimates, its mNAV sat between roughly 1.5x and 2.5x through 2024 and early 2025, and according to Bankless it traded above its Bitcoin holdings continuously from January 2024 until November 2025.
A premium, in other words, is a bet that management will turn it into more Bitcoin per share faster than dilution erodes it.
The 2025–2026 mNAV compression was the period when premiums across listed Bitcoin treasury companies shrank toward 1.0, and in many cases fell below it, as investors stopped paying extra for Bitcoin held through company shares.
It started with issuance discipline. On its Q2 2025 earnings call on July 31, Strategy said it would no longer issue common stock below 2.5x mNAV, with narrow exceptions. Two weeks later, on August 18, it widened those exceptions through an 8-K filing.
By October 2025, Forbes reported that 26 of the 168 public Bitcoin-holding companies tracked by BitcoinTreasuries.NET traded at a discount. On November 12, Strategy’s mNAV dipped to 0.97, its first discount since January 2024. By 30 November, CoinDesk cited figures of 0.856 basic, 0.954 diluted, and 1.105 on enterprise value. In June 2026, with Bitcoin near $60,000, CoinDesk reported that Strategy’s enterprise mNAV had fallen below 1.0.
This served to show that once the premium disappears, the flywheel often runs backwards. New equity dilutes existing holders, so companies either pause at-the-market programs or switch to debt and preferred stock, which adds senior claims ahead of common shareholders.
Discounts can also last. A spot ETF has authorized participants who create and redeem shares, which pulls its price back toward the value of its holdings. An operating company, on the other hand, doesn’t have this mechanism. Governance and custody questions, thin trading, running costs, and those senior claims can all hold the multiple down for a long time.
An mNAV below 1.0 doesn’t necessarily make a company’s shares a bargain, but it can tell you something about the company’s current market status.
mNAV, NAV, and BTC per share each answer a different question and they’re best used side by side.
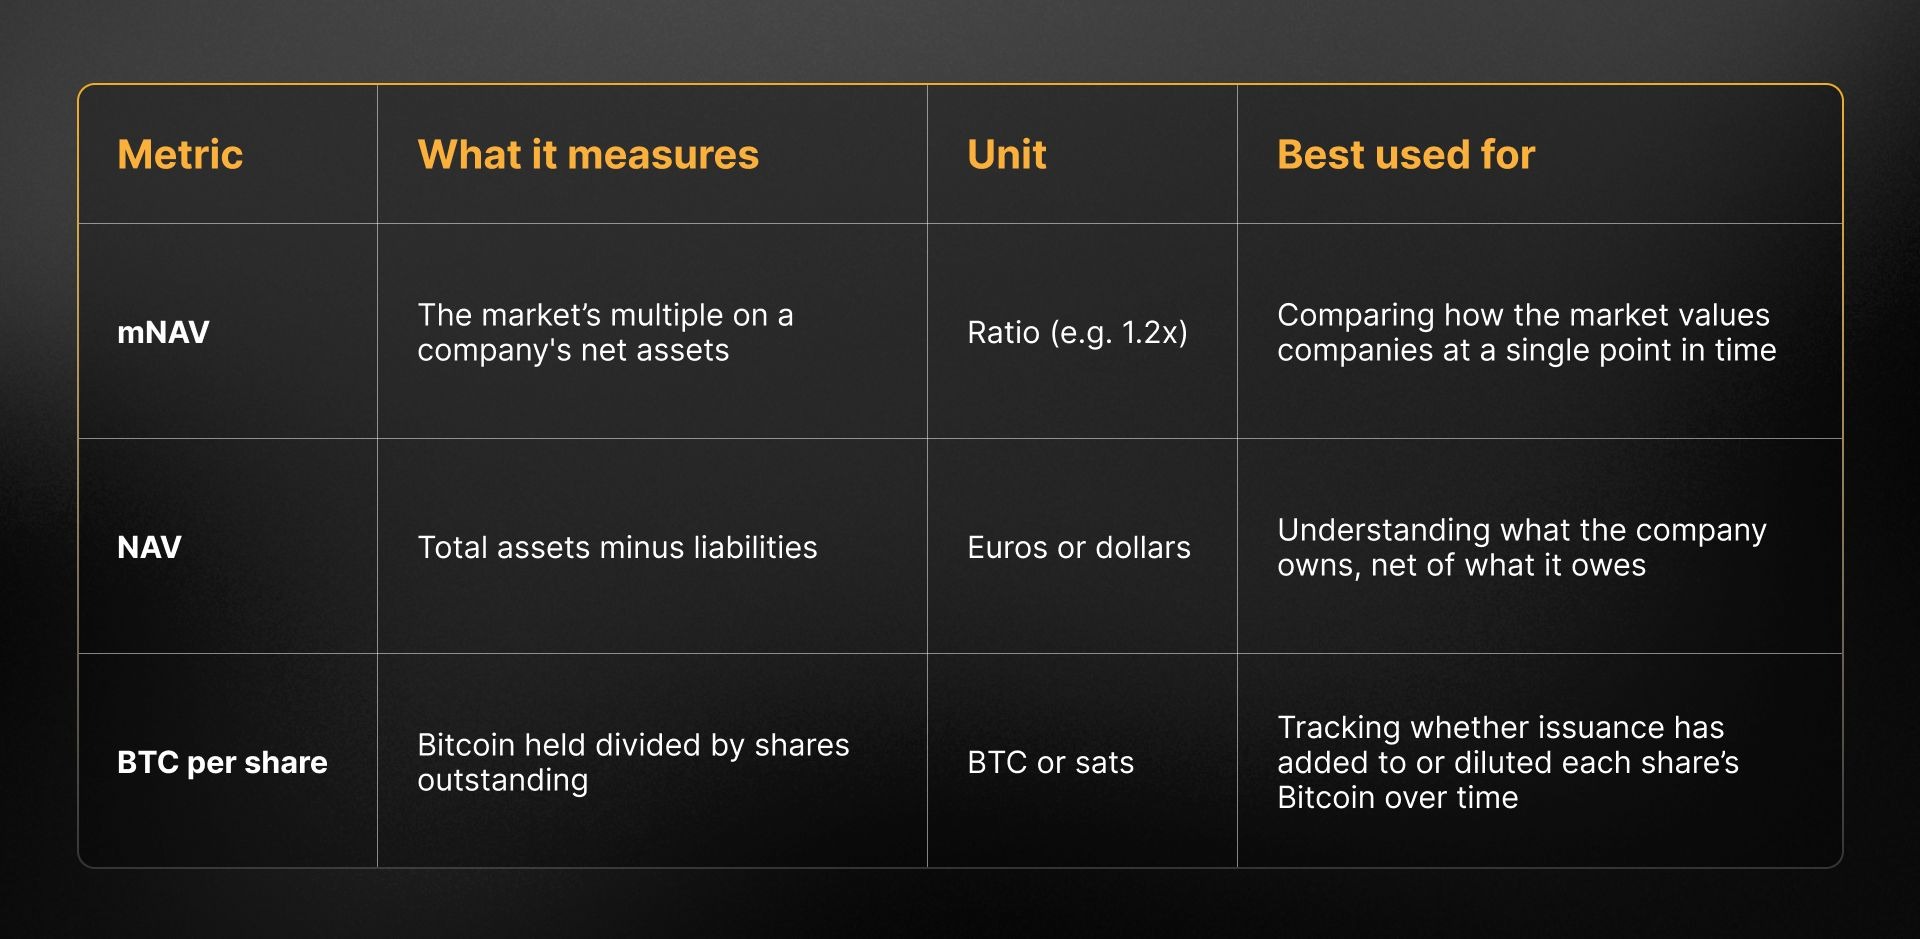
mNAV shows sentiment at a single moment, NAV grounds it in the balance sheet, while BTC per share tells you whether management has added to the shareholders’ holdings or thinned it out.
Plenty of listed Bitcoin holders also own operating businesses, fund stakes or cash. That means dividing market cap by BTC × price means that everything else is treated as worth zero. For these companies, a result like that would overstate the premium.
A fair mNAV uses full NAV, with each asset valued on its own terms and illiquid positions marked with a realistic discount.
The mNAV comes with its share of limitations that you should take into account.
First, it’s a snapshot metric that moves with the price of BTC. Even when a company’s balance sheet stays exactly the same, the number will change depending on the BTC price.
Methods also vary, since some trackers net out debt, some ignore it, and preferred stock can be handled differently. There’s also disclosure lag, which means that holdings are reported after purchases, and NAV for illiquid assets is only as current as the last valuation date.
mNAV also doesn’t tell you things like management quality, the company’s custody setup for its BTC, dilution discipline, and more. Those questions can sometimes be answered through the filings.
For more on-chain and market metrics, see our Bitcoin indicators hub.
There’s no universal good mNAV. What a given multiple means depends on the company’s debt, share structure, other assets, and business model, as well as the method used to calculate it. The same figure can reflect different situations depending on the company, which is why comparing like-for-like calculations is so important.
An mNAV below 1.0 means the market values the company at less than its net assets. Issuing new shares at that level dilutes existing holders per share. The discount may reflect concerns about debt, governance, liquidity, or costs, and it can persist because operating companies lack a redemption mechanism.
Trackers such as BitcoinTreasuries.net publish mNAV for many listed companies, often in basic, diluted, and enterprise-value versions. Some companies, including Strategy, report their own figures. For accuracy, confirm holdings, share counts, and liabilities against the company's primary filings and use exchange data for the share price.
No, the mNAV is different from an ETF premium/discount. An ETF’s authorized participants create and redeem shares, which keeps its price close to the value of its holdings. A listed company has no equivalent mechanism, so its shares can trade well above or below net asset value for long periods, and mNAV is the number designed to capture that gap.


