
Bitcoin
Bitcoin CPI
Venture-Portfolio
Fonds
Markteinblicke
Indikatoren






Über uns
Kontakt

September 21, 2026



Kaum ein Bewertungsmodell hat in der Geschichte von Bitcoin so viele Debatten ausgelöst wie das Stock-to-Flow-Modell (S2F). Als der pseudonyme Analyst PlanB das Konzept 2019 für Bitcoin adaptierte und populär machte, fand es schnell große Beachtung in Krypto- wie Mainstream-Finanzmedien. Polarisiert hat es seither durchgehend.
Stock-to-Flow ist ein Verhältnis, mit dem sich die Knappheit eines Gutes messen lässt, von Edelmetallen bis zu Kryptowährungen. PlanB nutzte die Kennzahl zur These, dass Bitcoins Knappheit einer der wichtigsten Treiber seines langfristigen Wertes sei und mit dem Kurs über eine Potenzgesetz-Beziehung korreliere. Selbst Kritiker des Modells räumen meist ein, dass es eine wesentliche Eigenschaft von Bitcoin erfasst: seine Knappheit.
Dieser Leitfaden erklärt das Bitcoin-Stock-to-Flow-Verhältnis und wie Analysten es zur Bewertung von Bitcoin verwenden.
Stock-to-Flow ist ein Modell, das die Knappheit eines Vermögenswerts misst, indem es den aktuellen Bestand (Stock) durch das jährlich neu in Umlauf kommende Angebot (Flow) teilt.
Die Formel ist einfach:
S2F = aktueller Bestand ÷ jährliches Neuangebot
Das resultierende S2F-Verhältnis gibt an, wie viele Jahre es bei der aktuellen Produktionsrate dauern würde, den bestehenden Bestand durch ein neues Angebot nennenswert zu vergrößern.
Je höher das Stock-to-Flow-Verhältnis, desto knapper der Vermögenswert. Rohstoffhändler nutzen diesen Rahmen seit Jahrzehnten für Edelmetalle wie Gold und Silber, weil er grob anzeigt, wie widerstandsfähig ein Gut gegen Inflation durch neues Angebot ist.
Zur Einordnung, wie unterschiedlich S2F über Anlageklassen hinweg ausfällt:
Diese Werte stammen aus PlanBs ursprünglicher Studie von 2019. Das ist relevant, weil Knappheit ein grundlegender Treiber der langfristigen Bewertung von Wertaufbewahrungsmitteln ist.
Bei Bitcoin ist das Verhältnis mechanisch so angelegt, dass es immer weiter steigt. Jedes Bitcoin-Halving halbiert die neu in Umlauf kommende BTC-Menge und wirkt damit direkt auf den Stock-to-Flow-Wert. Kein anderes Gut, Gold eingeschlossen, verfügt über einen vergleichbaren, fest einprogrammierten Mechanismus, der die Knappheit nach einem fixen, vorhersehbaren Zeitplan erhöht.
Bitcoin wurde mit Knappheit im Code entworfen. Das Gesamtangebot ist auf 21 Millionen BTC begrenzt, und keine einzelne Instanz kann dieses Limit ändern. Neue BTC gelangen durch Mining in Umlauf. Miner erhalten neu geschaffene Coins als Belohnung dafür, dass sie Transaktionen validieren und der Blockchain hinzufügen.
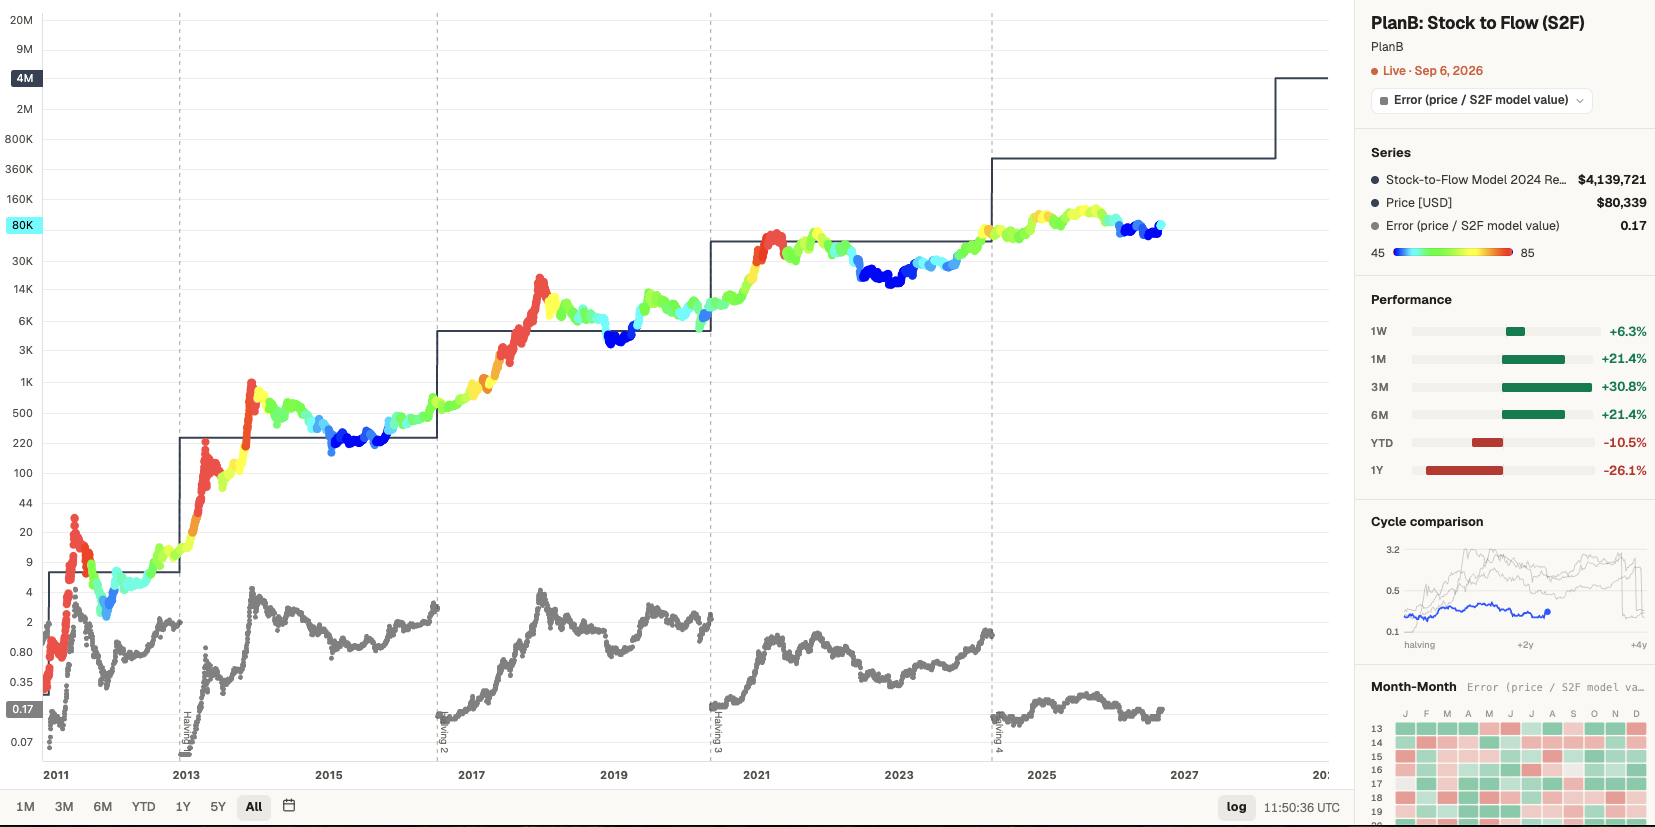
Diese Belohnung ist jedoch nicht konstant. Etwa alle vier Jahre halbiert ein fest einprogrammiertes Ereignis, das Halving, die Blockbelohnung und verlangsamt so die Entstehung neuer BTC.
Weil ein Halving den Flow halbiert, während der Bestand unverändert bleibt, verdoppelt jedes dieser Ereignisse das Stock-to-Flow-Verhältnis über Nacht. Zwischen den Halvings klettert das Verhältnis weiter, da neue Coins immer langsamer hinzukommen.

Auf jedes bisherige Halving folgte innerhalb von 12 bis 18 Monaten ein deutlicher Bullenmarkt. Vergangene Wertentwicklung garantiert allerdings nie künftige Ergebnisse.
Im März 2019 veröffentlichte der pseudonyme Investor PlanB auf Medium den Beitrag „Modeling Bitcoin's Value with Scarcity" und machte das Stock-to-Flow-Konzept damit im Krypto-Bereich populär.
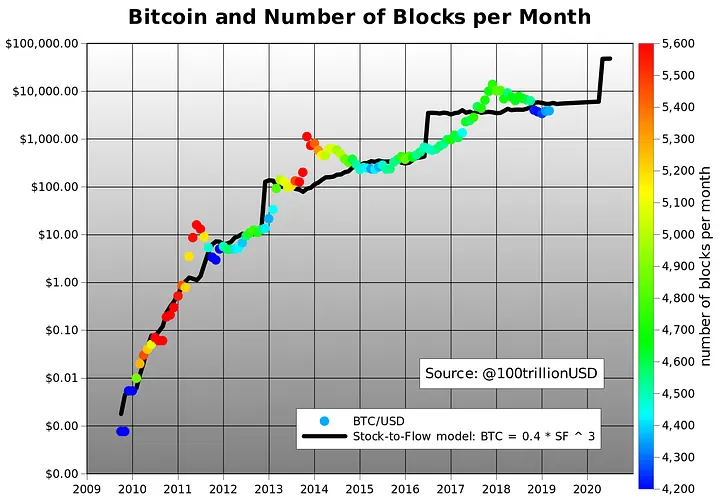
PlanBs Kernthese ist, dass Bitcoins Kurs eine Funktion seines S2F-Verhältnisses sei, wobei jedes Halving vorhersehbare Phasenübergänge in der Knappheit erzeugt und in der Folge im Kurs.
Das ursprüngliche Modell passte mit einem Bestimmtheitsmaß (R²) von etwa 95 Prozent zu den historischen Kursdaten, wobei Kritiker darin eher statistische Überanpassung als Prognosekraft sehen.
Für die Phase nach dem Halving 2020 projizierte das Modell eine durchschnittliche Bewertung um 55.000 US-Dollar. Im Zyklus 2020 bis 2024 traf das ein: BTC überschritt die prognostizierte Marke.
Im April 2020 verfeinerte PlanB das Modell zum S2FX (Stock-to-Flow Cross Asset Model) und ergänzte es um Phasenübergänge zwischen Anlageklassen. Für die Regressionsanalyse zog er zusätzlich die S2F- und Marktdaten von Gold und Silber heran. Das S2FX-Modell zeigte einen starken Zusammenhang zwischen S2F und dem Marktwert der verschiedenen Vermögenswerte, mit einer R²-Korrelation von 99,7 Prozent.
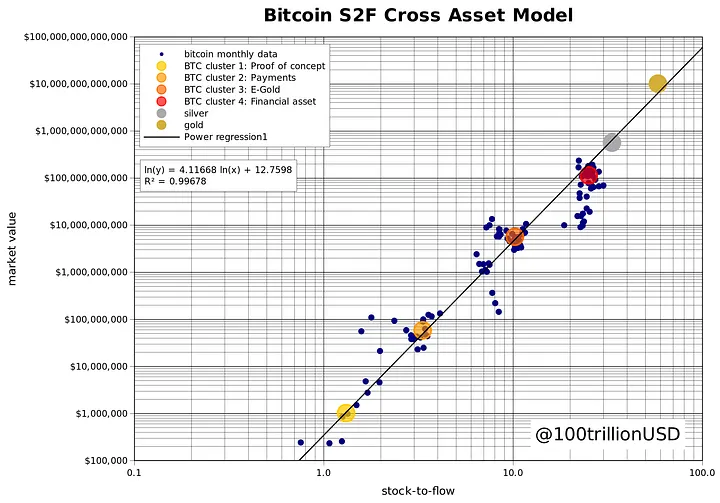
Auf Basis von S2FX prognostizierte PlanB für den Zyklus 2024 bis 2028 einen durchschnittlichen Bitcoin-Kurs zwischen 100.000 und 288.000 US-Dollar. Die aktuellen Kurse liegen allerdings deutlich unter weiten Teilen dieser Spanne.
Was das Stock-to-Flow-Modell so populär machte, waren nicht allein die Prognosen. Es war die Einfachheit der Formel, die zu einer nahezu perfekten statistischen Passform führte: mathematisch fundiert und überprüfbar. In einem weitgehend von Spekulation getriebenen Markt bot das Tradern etwas Greifbares.
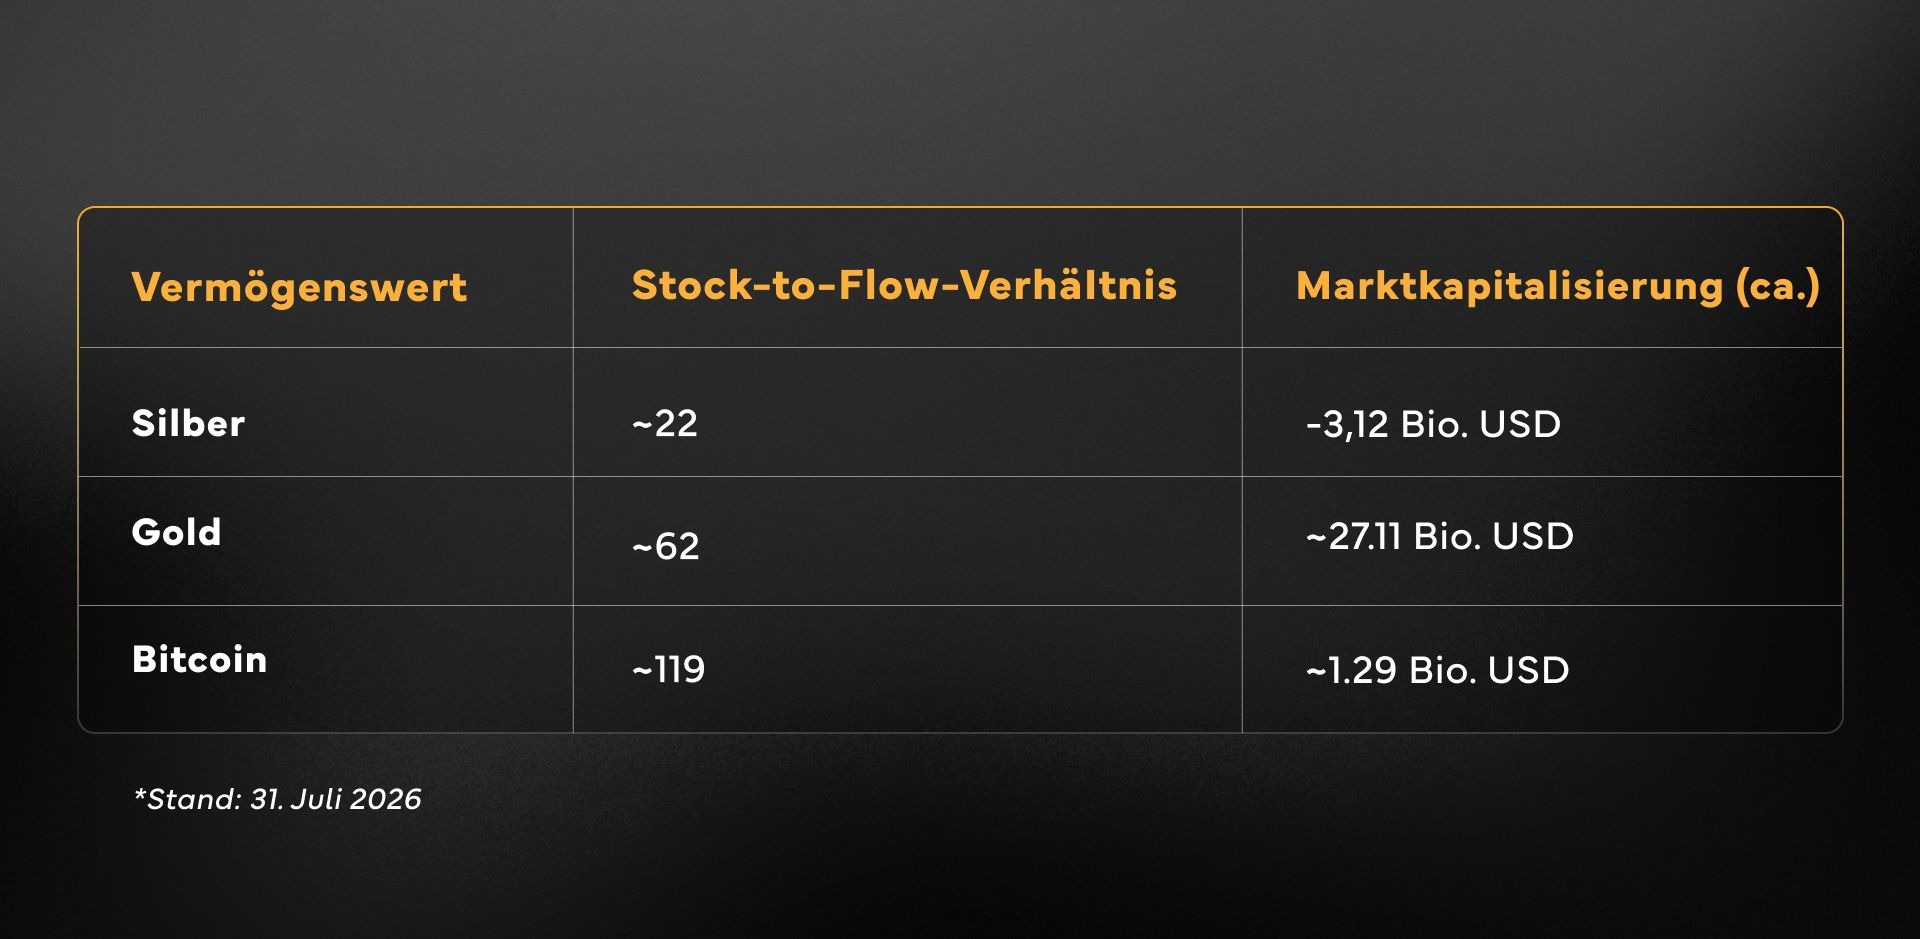
Die Schlussfolgerung, die PlanB aus dem Anlageklassen-Vergleich zog, war einfach: Wenn Bitcoin ein höheres Stock-to-Flow-Verhältnis erreicht als Gold, sollte seine Marktkapitalisierung der von Gold langfristig nahekommen oder sie übertreffen.
Das historische Gegenargument ist jedoch, dass Gold und Silber auf rund 5.000 Jahre Geldgeschichte zurückblicken. Gold ist zudem in den Reserven der Zentralbanken verankert, industriell in praktisch jeder Zivilisation im Einsatz und kulturell tief verwurzelt.
Bitcoin existiert seit 17 Jahren. Knappheit allein schafft eben noch keinen Wert.
Die Sicht der Bitcoin-Investoren dagegen ist, dass Bitcoins Angebotsplan im Code festgeschrieben ist. Jede Blockbelohnung, jedes Halving und die Gesamtmenge stehen im Voraus fest. Gold hingegen hängt von Geologie, Minenfunden und Recycling ab, denn niemand weiß genau, wie viel davon noch im Boden liegt.
Trotz seiner Popularität hat das Modell erhebliche Schwächen.
Der grundlegendste Kritikpunkt ist die Überbetonung der Knappheit. Das Modell unterstellt, Knappheit sei der einzige Kurstreiber, und ignoriert die komplexeren Wertdynamiken von Bitcoin, wie zum Beispiel die Adoptionsraten, ETF-Zuflüsse, Makro-Ereignisse und das regulatorische Umfeld, die allesamt zur Nachfrage und Marktbewertung beitragen. Ein Modell mit nur einer Eingangsgröße wird sich in einem Markt mit vielen Einflussfaktoren immer schwer tun.
Der größte Fehlschlag kam 2022. PlanB hatte auf X (vormals Twitter) prognostiziert, BTC werde bis Ende 2021 die Marke von 100.000 US-Dollar erreichen. Tatsächlich erreichte der Kurs im November 2021 ein Hoch von 68.000 US-Dollar und fiel bis November 2022 auf rund 16.000 US-Dollar. Eine sichtbare Neukalibrierung des Modells steht seither aus.
Auch das statistische Fundament des Modells ist breit angefochten worden. Nico Cordeiro von Strix Leviathan argumentierte, dass die Regression der Marktkapitalisierung auf das S2F-Verhältnis im Kern den Bestand auf sich selbst regressiert, was ein hohes R² erzeugt, das eine Scheinkorrelation statt eines kausalen Zusammenhangs widerspiegelt. Ethereum-Mitgründer Vitalik Buterin kritisierte das Modell zudem für die falsche Kursgewissheit, die es vermittle.
Darüber hinaus fehlt dem Modell jeder Mechanismus für nachfrageseitige Schocks, was eine erhebliche Einschränkung für jedes Bewertungsmodell darstellt.
Bitcoin-Investoren behandeln das Stock-to-Flow-Verhältnis daher meist als einen von mehreren Zyklusrahmen, die sie im Blick behalten, nicht als verlässliches Kursprognosemodell.
Das Richtungssignal hat sich über die Jahre gehalten, die konkreten Kursziele haben dagegen mehrfach daneben gelegen: Das ursprüngliche S2F-Modell sagte 100.000 US-Dollar bis Ende 2021 voraus, was nicht eintrat, und die S2FX-Projektion von bis zu 288.000 US-Dollar für den laufenden Zyklus hat sich bislang nicht materialisiert.
Knappheit gehört zu den grundlegendsten Eigenschaften von Bitcoin: ein harter, mathematisch definierter Angebotsplan, den kaum ein anderer Vermögenswert vorweisen kann. Die ganze Geschichte ist das jedoch nicht, denn Knappheit allein bestimmt Bitcoins Kurs nicht.
Eine weitere Perspektive auf Bitcoins monetäre Eigenschaften bietet Samaras Bitcoin Consumer Price Index (BTCCPI). Er misst, wie sich der Wert des Warenkorbs der offiziellen Verbraucherpreisindizes in Europa und den USA über die Zeit verändert, wenn er in Bitcoin (BTC) berechnet wird.
Stand 2026 liegt Bitcoins Stock-to-Flow-Verhältnis bei etwa 119, unverändert seit dem Halving im April 2024. Nach dieser Kennzahl ist BTC damit knapper als Gold. Das Verhältnis dürfte bis zum nächsten Halving, das für 2028 erwartet wird, bei rund 119 liegen.
Die Bilanz ist seit 2021 durchwachsen, und die Kursprognosen des Modells weichen seit Ende 2021 deutlich von der Realität ab. Das Richtungssignal zu halving-getriebenen Angebotsverknappungen hat sich gehalten, die konkreten Kursziele gelten jedoch weithin als unzuverlässig.
S2F ist PlanBs ursprüngliches Modell von 2019, das Bitcoins Knappheit als Verhältnis von Bestand zu jährlichem Neuangebot berechnet. S2FX ist die im April 2020 veröffentlichte Erweiterung, die Phasenübergänge zwischen Bitcoin und anderen monetären Vermögenswerten (Silber und Gold) einbezieht.
Jedes Halving halbiert die neue BTC-Ausgabe etwa alle vier Jahre und verdoppelt damit näherungsweise das Stock-to-Flow-Verhältnis, da S2F den Bestand durch das jährliche Neuangebot teilt. Das Halving 2024 hob den S2F-Wert von rund 58 auf rund 119.
Disclaimer: Die Inhalte dieses Artikels dienen ausschließlich der allgemeinen Information und stellen keine Anlage-, Steuer- oder Rechtsberatung dar. Sie sind weder ein Angebot noch eine Aufforderung zum Kauf oder Verkauf von Bitcoin, anderen Krypto-Assets oder Wertpapieren, einschließlich der Aktien der Samara Asset Group plc. Die dargestellten Indikatoren und Daten beziehen sich auf die Vergangenheit. Frühere Wertentwicklungen sind kein verlässlicher Indikator für künftige Ergebnisse. Investitionen in Krypto-Assets unterliegen starken Kursschwankungen und sind mit erheblichen Risiken bis hin zum Totalverlust des eingesetzten Kapitals verbunden. Alle Angaben wurden mit Sorgfalt zusammengestellt, dennoch übernimmt die Samara Asset Group plc keine Gewähr für ihre Richtigkeit, Vollständigkeit und Aktualität. Treffen Sie Anlageentscheidungen ausschließlich auf Grundlage eigener Prüfung und ziehen Sie bei Bedarf einen unabhängigen, qualifizierten Finanzberater hinzu.


