
Bitcoin
Bitcoin CPI
Venture Portfolio
Funds
Market Insights
Indicators
About
Contact
The Bitcoin Hash Ribbons indicator is an indicator used by Bitcoin traders to assess market sentiment and identify potential entry points. By tracking Bitcoin’s short- and long-term hash rate trends, you can potentially spot a possible market bottom during a downturn.

The Hash Ribbons indicator shows how miner activity and changes in the mining landscape can signal potential shifts in market sentiment and, subsequently, Bitcoin’s price, particularly during periods of weakness.
The indicator tracks fluctuations in the network’s computational power and identifies phases of miner capitulation, which might occur when mining becomes less profitable. These periods can precede or accompany downward pressure on the price of Bitcoin, making the indicator potentially helpful for spotting price bottoms.
Specifically, the indicator tracks the 30-day simple moving average (MA) of the hash rate (short-term MA) and the 60-day simple moving average of the hash rate (long-term MA).
A rising hash rate means more miners are competing in this race, which allows its winners to collect the block reward of 3.125 BTC and transaction fees. Conversely, when the hash rate drops, it means that some miners have left the network, increasing the chances for others to find a new block and collect the reward.
The hash rate usually grows during a BTC price rally and might drop during a downturn. It’s also affected by Bitcoin mining difficulty, which is adjusted every two weeks to make sure that the average Bitcoin block time, or how much time it takes to find a new block, remains around 10 minutes. The more miners join the network, the more difficult it becomes to find a block.
The Hash Ribbons indicator uses the 30-day and 60-day MAs to visualize changes in mining activity. These lines help distinguish between short-term fluctuations and more sustained shifts in miner behavior.
The interaction between these two lines forms the basis of the indicator's signals because, in some cases, a falling hash rate doesn’t just signal a temporary decline in activity; it might also indicate miner capitulation.
Miner capitulation occurs when mining becomes economically unsustainable for a substantial share of miners, often due to a drop in Bitcoin’s price or rising operational costs.
Bitcoin Price Chart and the Hash Ribbons Indicator During Miner Capitulation
As a result, miners shut down their equipment, which might also be followed by a sell-off of their BTC reserves that the miners were planning on selling during a bull run.
To better understand how the Hash Ribbons indicator behaves, let’s walk through a common scenario.
Imagine the 30-day MA of the hash rate starts rising, often in parallel with an increase in the price of Bitcoin. However, if the market suddenly turns and Bitcoin’s price begins to fall, the 30-day MA may also start declining as mining profitability drops, forcing some of the miners to leave the network.
When it crosses below the 60-day MA, the Hash Ribbons can signal the start of miner capitulation. Conversely, when the 30-day MA moves above the longer-term average, it might mean the end of capitulation and decreased BTC selling by miners.
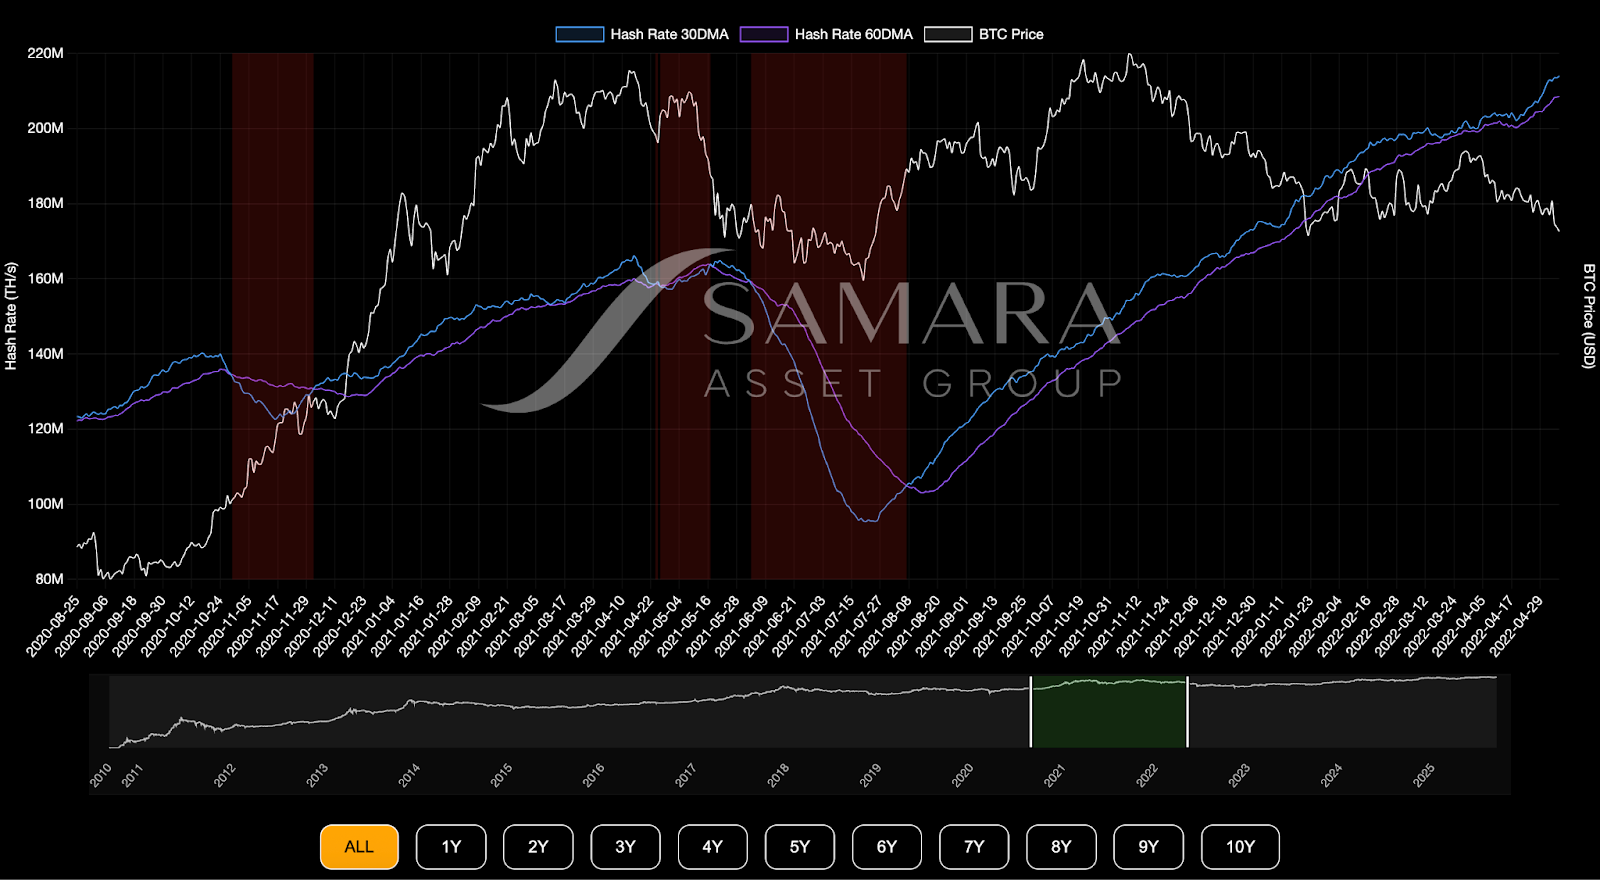
A clear example of miner capitulation occurred in 2021 (as seen in the chart above). In March of that year, Bitcoin surpassed $60,000. However, in May, the market turned sharply downward, with the price falling to nearly $30,000 in June.
This sudden drop reduced mining profitability, leading to a noticeable decline in hash rate as mining became less attractive for some operators. Moreover, a large share of Bitcoin miners in China were forced to turn their machines off due to unfavorable policies locally.
During this period, the 30-day MA dropped below the 60-day MA, signaling stress in the mining network, and the Hash Ribbons indicator entered negative territory. Such capitulation phases can last for several weeks, depending on price dynamics.
Eventually, the network begins to recover. As the 30-day MA rises again and crosses back above the 60-day MA, this can indicate that miner capitulation is nearing its end. However, it’s worth noting that Bitcoin’s price may still be trending downward at this stage, reflecting broader market uncertainty.
Near the end of the capitulation phase, or in its early recovery, the Hash Ribbons indicator flashes a signal, which marks the return of positive momentum in the mining industry.
Previously, this has coincided with a gradual improvement in hash rate and a more stable price trend. Once the 30-day MA moves firmly above the 60-day MA, the indicator may no longer highlight capitulation, and the market may enter a more neutral or upward phase.
By the time capitulation appears on the Bitcoin Hash Ribbons indicator, much of the selling pressure from miners may already be absorbed, while the exit of weaker miners leads to increased mining profitability, which decreases the BTC selling pressure. As a result, this phase is often seen as the bottom of a specific market downturn.
This connection between miner behavior and the price of BTC is one reason why capitulation events are closely watched, as miner capitulation might coincide with market bottoms. This does not mean it causes them, but rather reflects that the network has undergone a period of stress and adjustment.
The Bitcoin Hash Ribbons indicator has consistently demonstrated its ability to highlight periods of miner stress that often align with local market bottoms. While it does not predict price direction directly, its signals have historically appeared near key turning points in Bitcoin’s market cycles.
One of the indicator’s main strengths is its focus on internal network dynamics before they are reflected in price action.
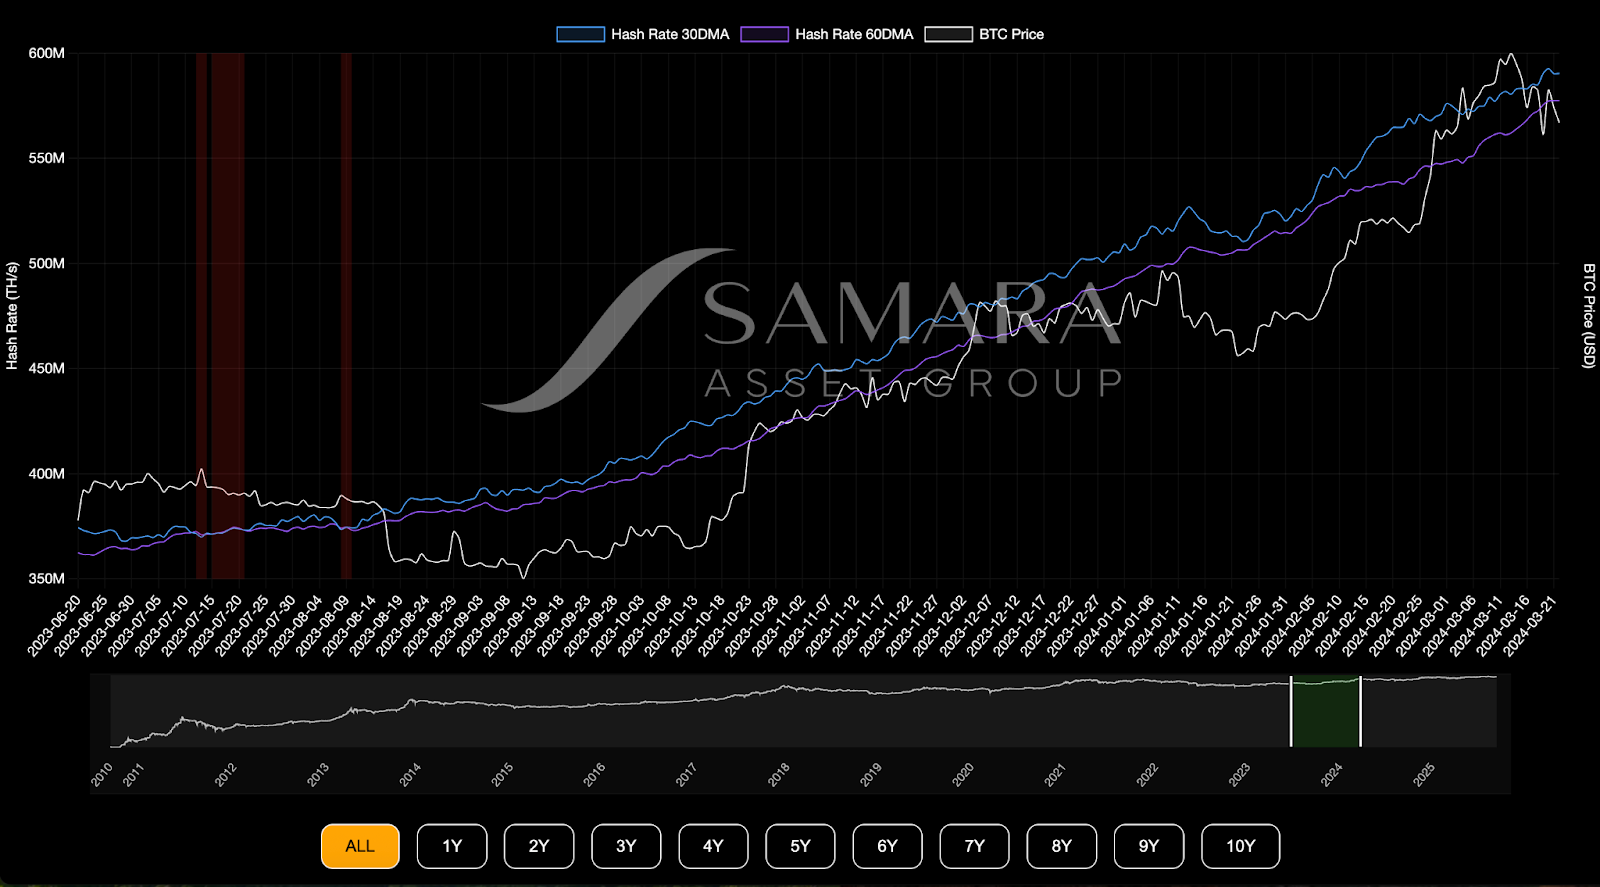
One example occurred in November 2022 when the price of Bitcoin dropped below $16,000 following the collapse of the FTX exchange. The sharp decline in market confidence and falling prices led to a drop in mining profitability. As a result, the hash rate decreased, and the Bitcoin Hash Ribbons indicator reflected miner capitulation during this period.
In early January 2023, the indicator flashed a recovery signal while the price of Bitcoin was still relatively low. Over the following months, Bitcoin gradually climbed above $30,000, supported by improving network conditions and renewed market interest.
The Hash Ribbons Indicator Signals Potential Market Recovery in 2023
Another example can be seen in July 2024, when Bitcoin had been declining for several months and was trading at below or around $55,000. The prolonged downturn affected mining profitability, leading to a drop in hash rate and triggering miner capitulation, which was also seen in the Bitcoin Hash Ribbons indicator. As the network began to stabilize, a recovery signal appeared.
The Hash Ribbons Indicator Signals Miner Capitulation in 2024
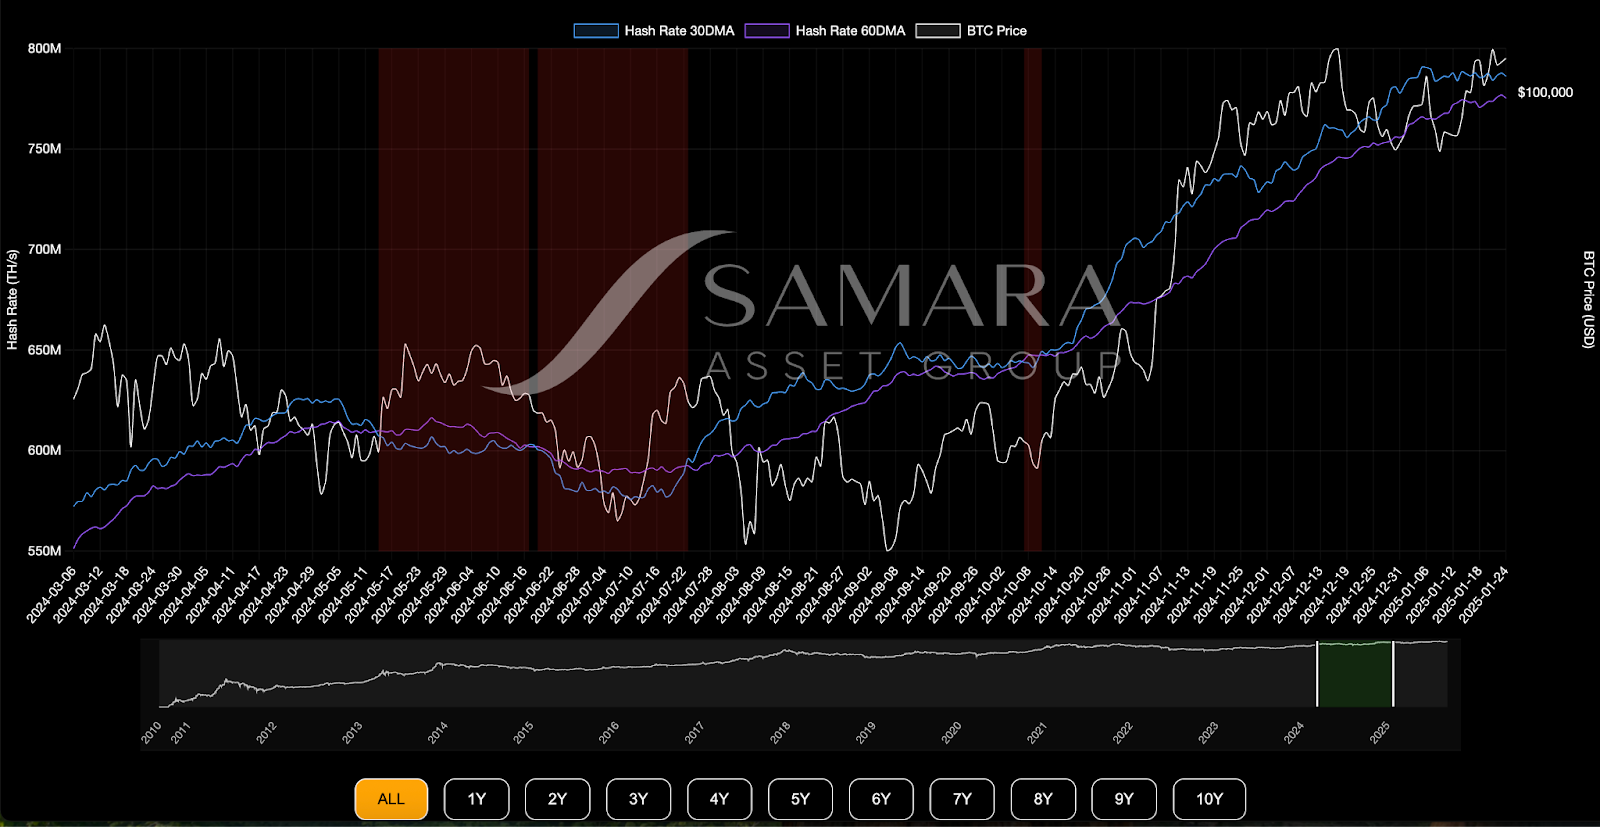
In the following months, Bitcoin gained momentum and eventually surpassed $100,000 in December, reaching a new all-time high (ATH).
The Hash Ribbons indicator can be used by traders to identify potential entry points during a market downturn.
The key signal traders typically watch for is when the 30-day moving average of the hash rate firmly crosses above the 60-day average, as miner capitulation ends. Traders view this as an indicator that the worst may be over, signaling that the mining industry is stabilizing and miners are becoming more active.
While this doesn’t guarantee that the price will rise immediately, it’s often seen as a sign that market sentiment is shifting, making it a crucial tool for traders looking to enter the market after a period of decline.
This signal often appears near the end of bearish market sentiment, when price fluctuations begin to stabilize. Traders use it as a sign to enter positions during the late stage of a downtrend, when the hash rate is recovering and the price may start to show signs of upward movement.
The Bitcoin Hash Ribbons indicator doesn’t guarantee future price behavior and shouldn’t be used in isolation. It’s a lagging indicator, which means its signals often appear after changes in network conditions have already begun.
In some cases, the price of Bitcoin may continue to fall even after the signal is triggered. Although historically, these signals have often preceded recoveries, this isn’t always the case.
Additionally, Hash Ribbons is focused solely on internal network data and doesn’t take into account external events such as regulatory changes, political or geopolitical developments, or sudden shifts in global investor sentiment, all of which can impact the market independently of miner activity.
While the Bitcoin Hash Ribbons indicator is an interesting tool for market analysis, it's just one of many indicators you can use to analyze the Bitcoin market.
A long list of factors determines the price of Bitcoin, so you can never rely on a single indicator to make your investment decisions. Don’t just take one indicator’s word for it. Always do your own research before jumping in.
The Bitcoin Hash Ribbons indicator shows a buy signal when the 30-day hash rate moving average firmly crosses above the 60-day, typically after a period of miner capitulation. This crossover suggests that network conditions are stabilizing and that miners are returning, which historically has occurred near market bottoms.
The Bitcoin Hash Ribbons indicator is mainly used for medium- to long-term signals. Due to its lagging nature, it’s less effective for short-term trading.


